EditorSingle Test AnalysisSpace plays · scrolls the page
Single Test Analysis
Problem
For educational staff, navigating and interpreting data has long been a daunting task. Our existing data tool, while rich in information, is trapped in a legacy-style interface characterized by small fonts, tight columns, and what feels like a never-ending table. Although staff could eventually find the information they needed, the process of sifting through these dense tables was cumbersome and frustrating. This challenge not only hindered efficiency but also affected the overall user experience. Recognizing the potential impact on our users, we initiated a research effort to gather more evidence and validate whether this issue was widespread, setting the stage for a much-needed redesign.
Research
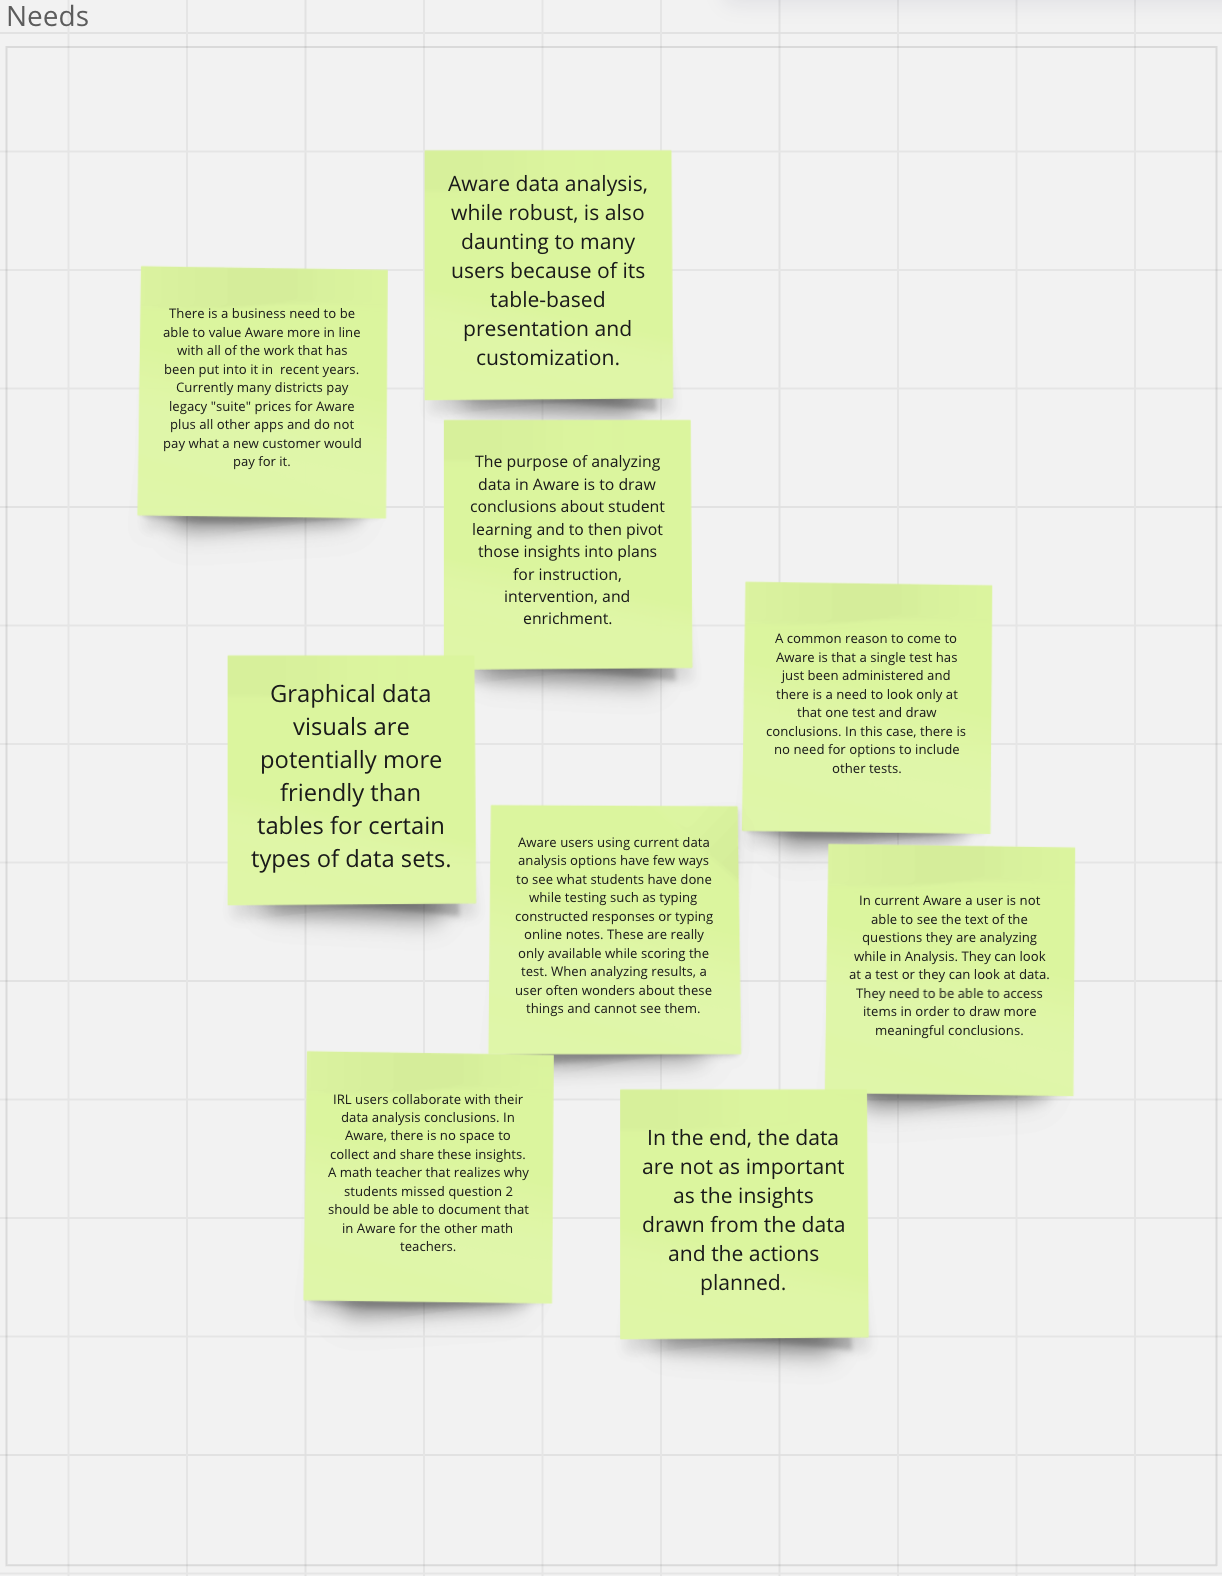
To ensure our redesign would address the real needs of our users, we began by identifying the right people to interview. Working within the educational sector, we had to navigate several processes to gain access to staff and students. Through the appropriate channels, we successfully connected with a diverse group of participants, including young students, youth program staff, school teachers, and campus administrators.
This research phase spanned six months, during which we meticulously explored the pain points of each group. We documented all feedback and insights in Dovetail, ensuring a structured approach to data collection. As we conducted interviews, we tagged and organized the information based on specific themes, preparing it for later synthesis in Miro. This methodical approach allowed us to capture a comprehensive understanding of the challenges our users faced, laying a solid foundation for informed design decisions.
This research phase spanned six months, during which we meticulously explored the pain points of each group. We documented all feedback and insights in Dovetail, ensuring a structured approach to data collection. As we conducted interviews, we tagged and organized the information based on specific themes, preparing it for later synthesis in Miro. This methodical approach allowed us to capture a comprehensive understanding of the challenges our users faced, laying a solid foundation for informed design decisions.
Insights and Synthesis
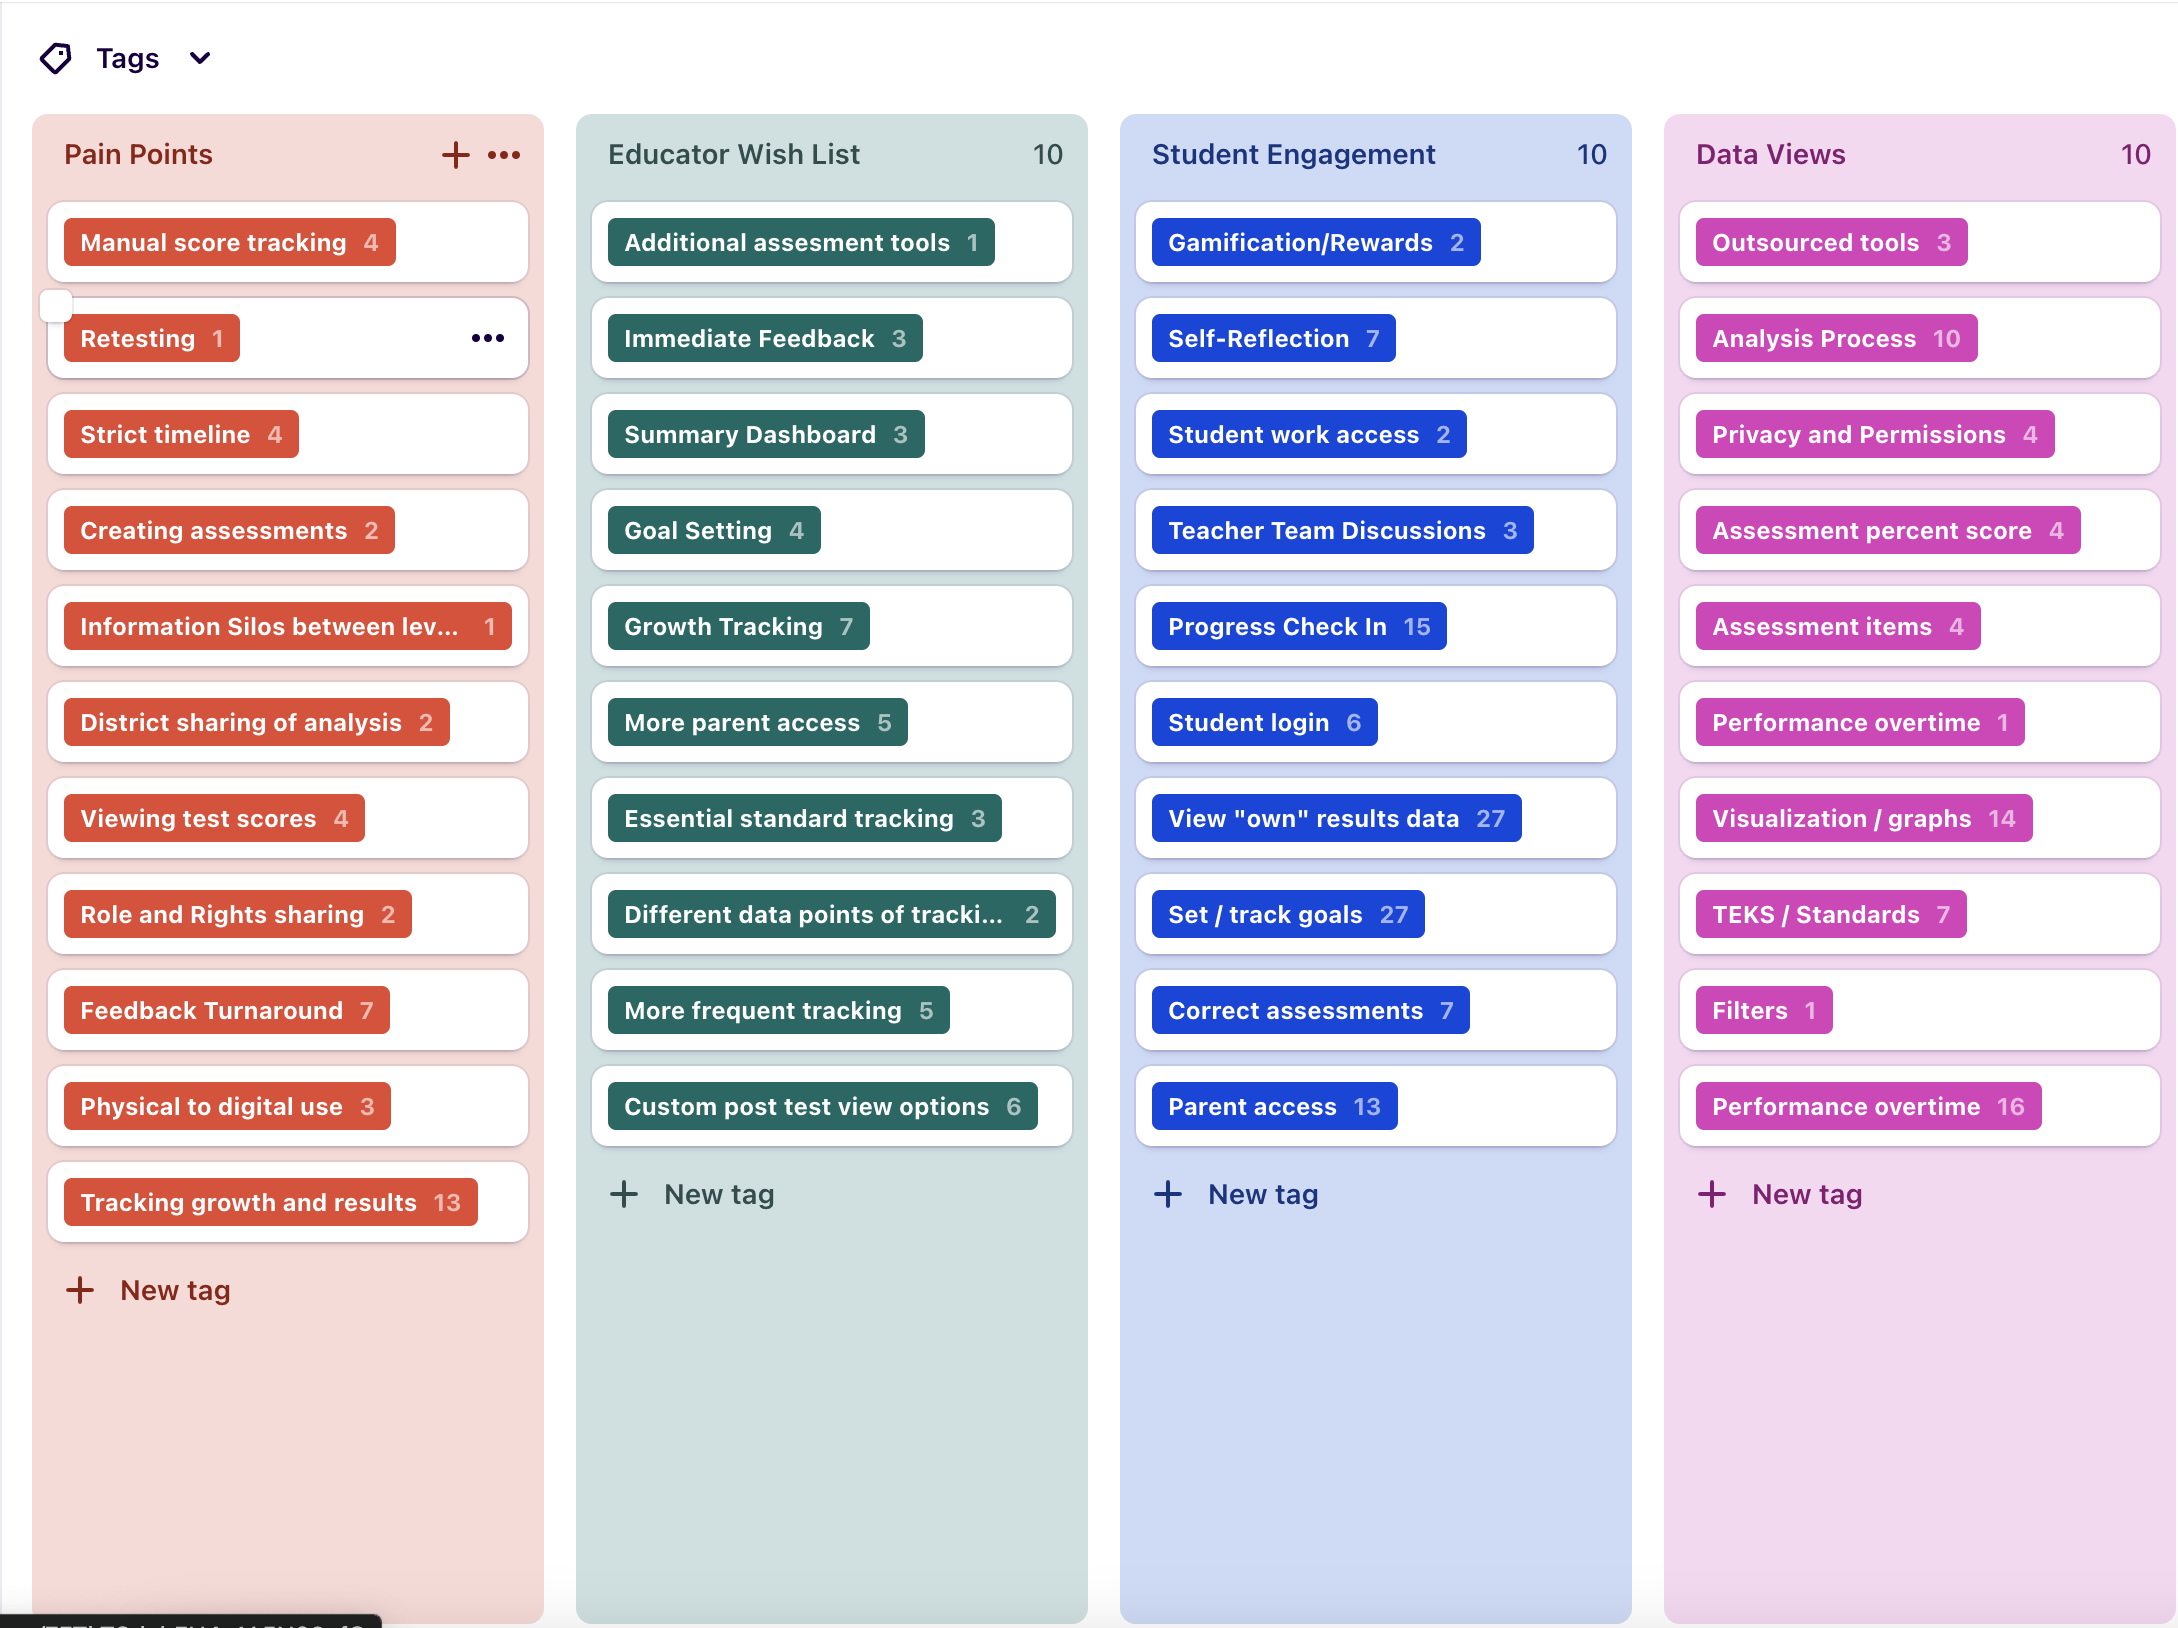
After completing our research, we confirmed several critical insights that aligned with our initial hypotheses. First and foremost, we validated that our current system lacked an effective way to visualize and interpret student data quickly and efficiently. This inefficiency forced educators to spend more time analyzing data and less time providing the necessary support to students—a significant concern for time-strapped teachers and administrators.
We also uncovered that teachers were frequently toggling between multiple views to access essential information, such as student-written responses or Technologically Enhanced Items (TEIs). This back-and-forth not only disrupted their workflow but also added to the time burden.
Finally, we gained a deeper understanding of how this data was being used. Educators rely on a combination of student responses, standards information, and overall scores to assess whether student intervention is necessary. These insights underscored the need for a more integrated and user-friendly tool. With a clear understanding of these challenges, we were ready to define the scope of the project and begin crafting a solution that would truly meet our users’ needs.
We also uncovered that teachers were frequently toggling between multiple views to access essential information, such as student-written responses or Technologically Enhanced Items (TEIs). This back-and-forth not only disrupted their workflow but also added to the time burden.
Finally, we gained a deeper understanding of how this data was being used. Educators rely on a combination of student responses, standards information, and overall scores to assess whether student intervention is necessary. These insights underscored the need for a more integrated and user-friendly tool. With a clear understanding of these challenges, we were ready to define the scope of the project and begin crafting a solution that would truly meet our users’ needs.
Setting Scope Using Shape Up Process
To manage the complexity of our projects effectively, our company follows a structured process, breaking projects into manageable 8-week cycles. This approach allows us to maintain focus, adapt to feedback, and ensure steady progress over time. For this project, the scope of our initial design cycle was clearly defined: we aimed to create 2 of the 3 essential data visualization pages, in the first cycle and the third the second cycle. By focusing on these critical components first, we ensured that we could deliver meaningful progress while setting the stage for the final piece of the visualization suite in subsequent cycles. This phased approach not only kept the project on track but also allowed us to refine and iterate on our designs based on real-time feedback.
Build Performance Summary Tab
- Show student performance results (raw scores) with the test’s performance level bands grouped and selectable
- Data table below the graph showing performance broken out by demographic groups
- Selecting a performance level in the graph or performance column in the table highlights the same group in both areas (for eventual Insights)
- Selecting demographics
Build Learning Standard Summary Tab
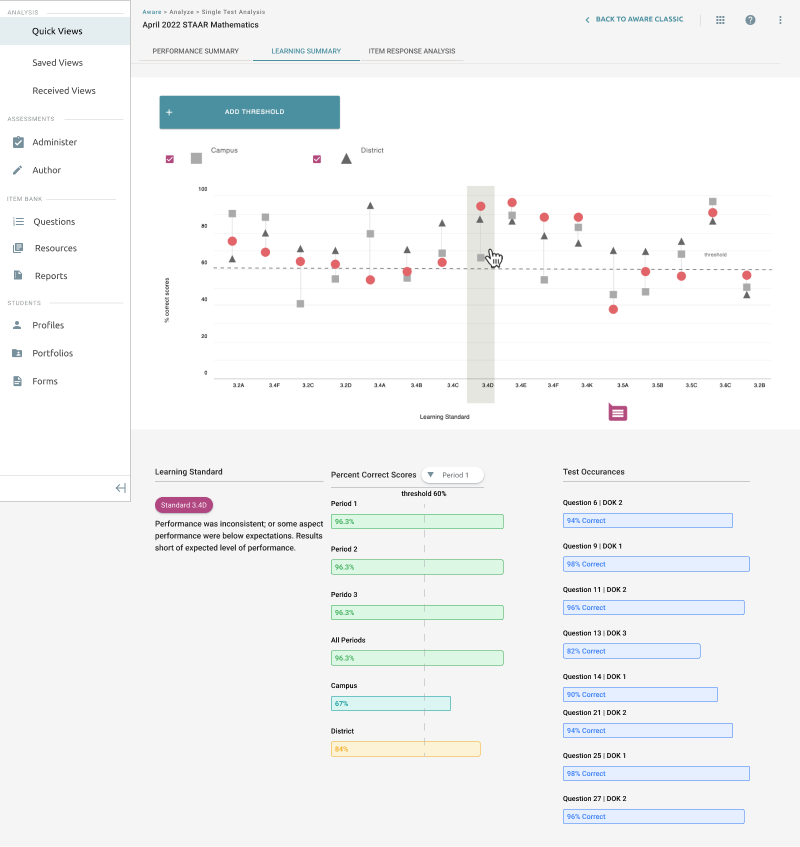
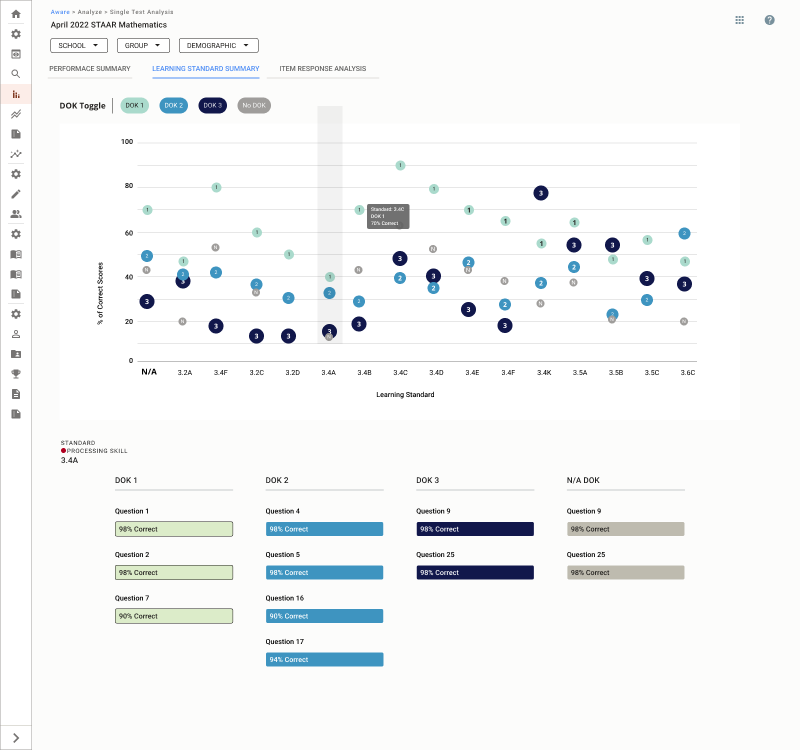
- Show learning standards and data
- Show data for questions without learning standards
- Display the level of difficulty for each question and what standard was assigned to it.
- Select the standard to gain more insight into how many students got the questions in that standard correct.
Build Item Response Analysis Tab
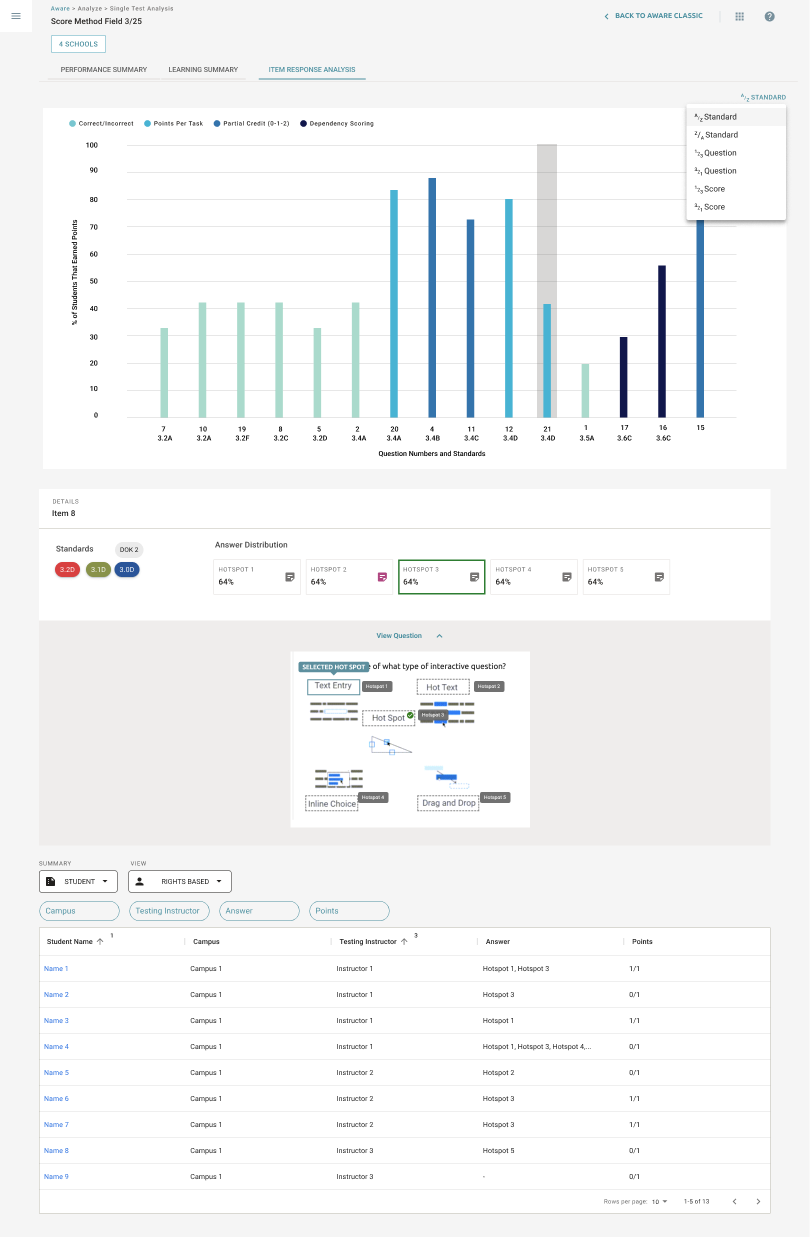
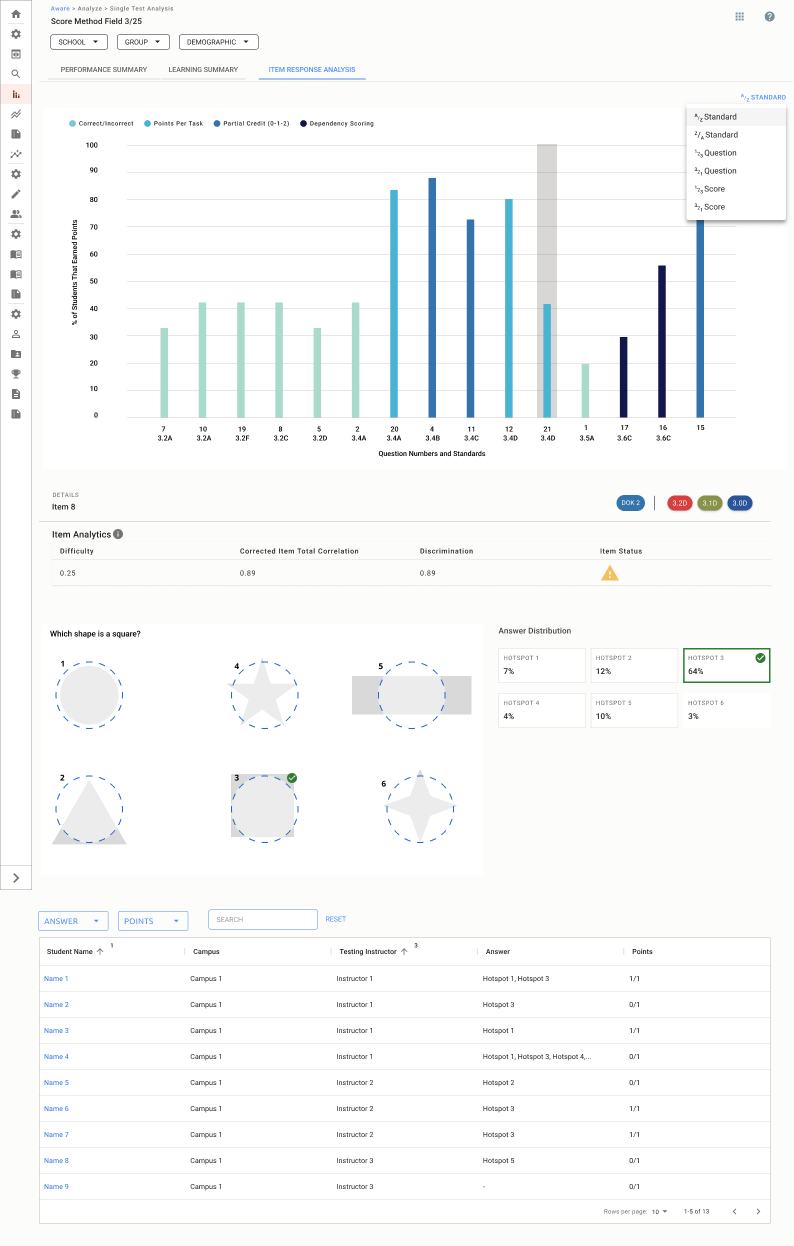
- Show learning standards and data
- Show data for questions without learning standards
- Display the level of difficulty for each question and what standard was assigned to it.
- Select the standard to gain more insight into how many students got the questions in that standard correct.
Design
Our first step in the design process was to determine the essential features needed for the Single Test Analysis tool. Fortunately, our existing data tables provided a solid foundation, offering key information such as student demographics, overall assessment scores, standards information, and responses to straightforward questions like multiple-choice and multi-select.
However, through our research, we identified additional user needs, such as incorporating question difficulty levels and improving access to responses for more complex question types. These insights were crucial in shaping the tool to better serve our users.
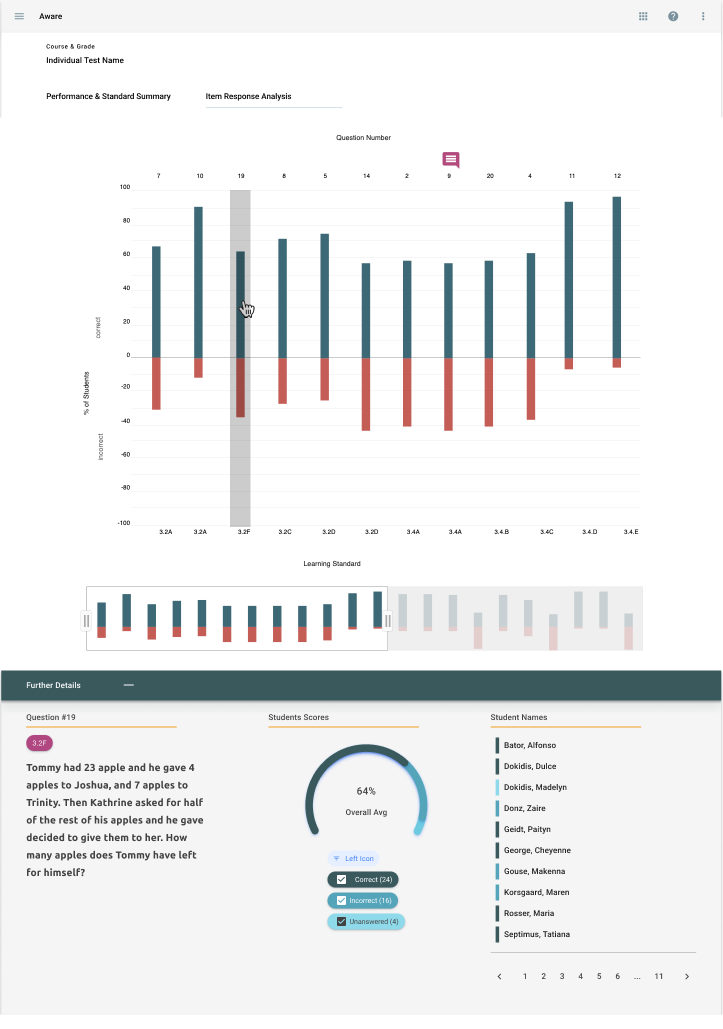
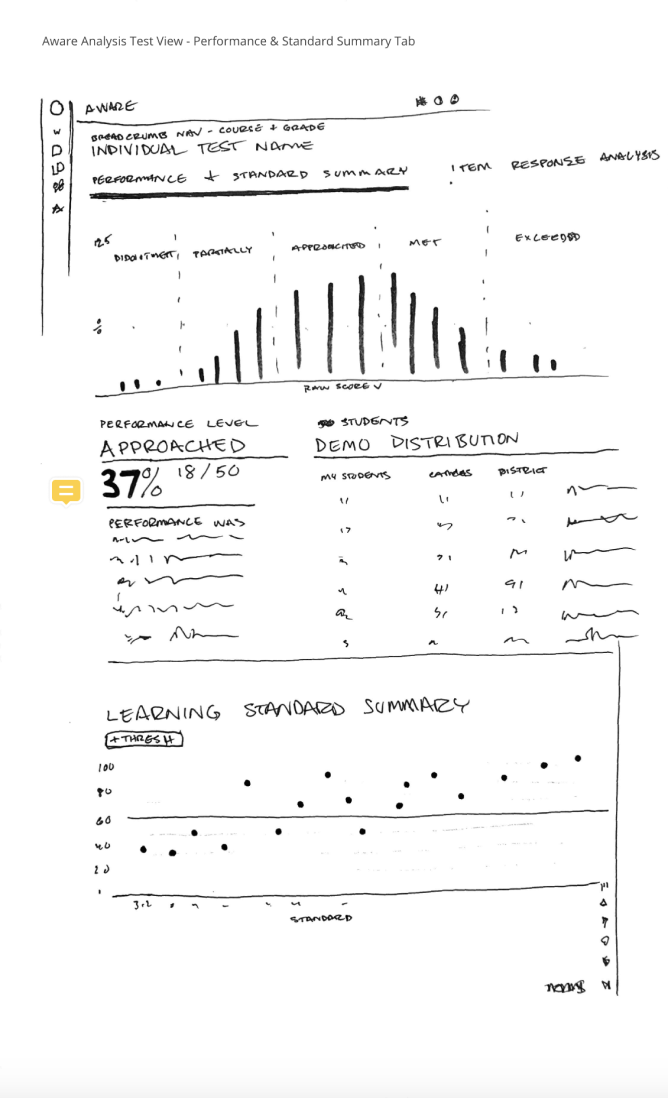
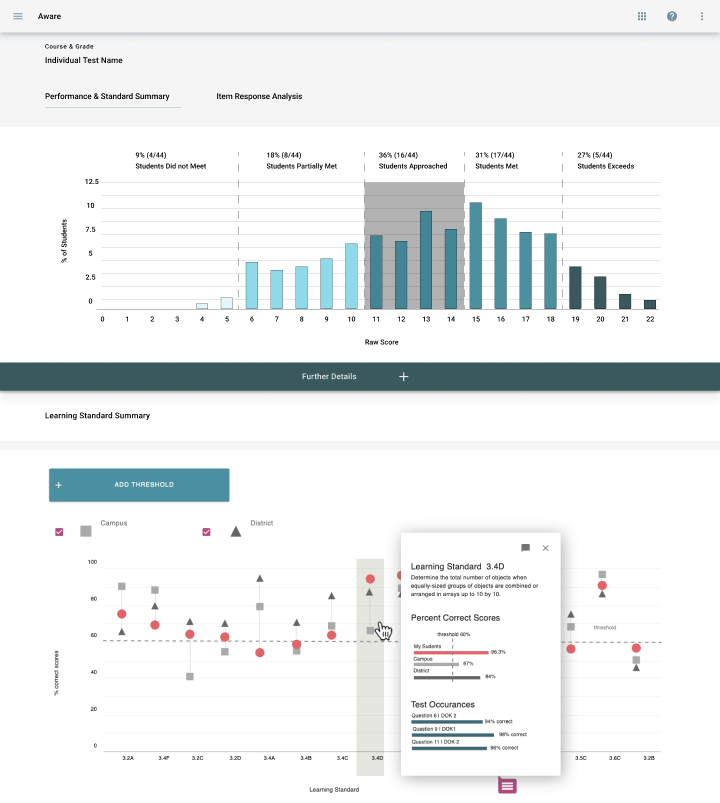
Given that this was my first major project, I collaborated closely with my design lead to explore various possibilities. Together, we sketched out initial concepts, which I then translated into mid-fidelity mockups. This collaborative approach allowed us to refine our ideas and ensure that the design aligned with user needs and project goals.
However, through our research, we identified additional user needs, such as incorporating question difficulty levels and improving access to responses for more complex question types. These insights were crucial in shaping the tool to better serve our users.
Given that this was my first major project, I collaborated closely with my design lead to explore various possibilities. Together, we sketched out initial concepts, which I then translated into mid-fidelity mockups. This collaborative approach allowed us to refine our ideas and ensure that the design aligned with user needs and project goals.
Iterations
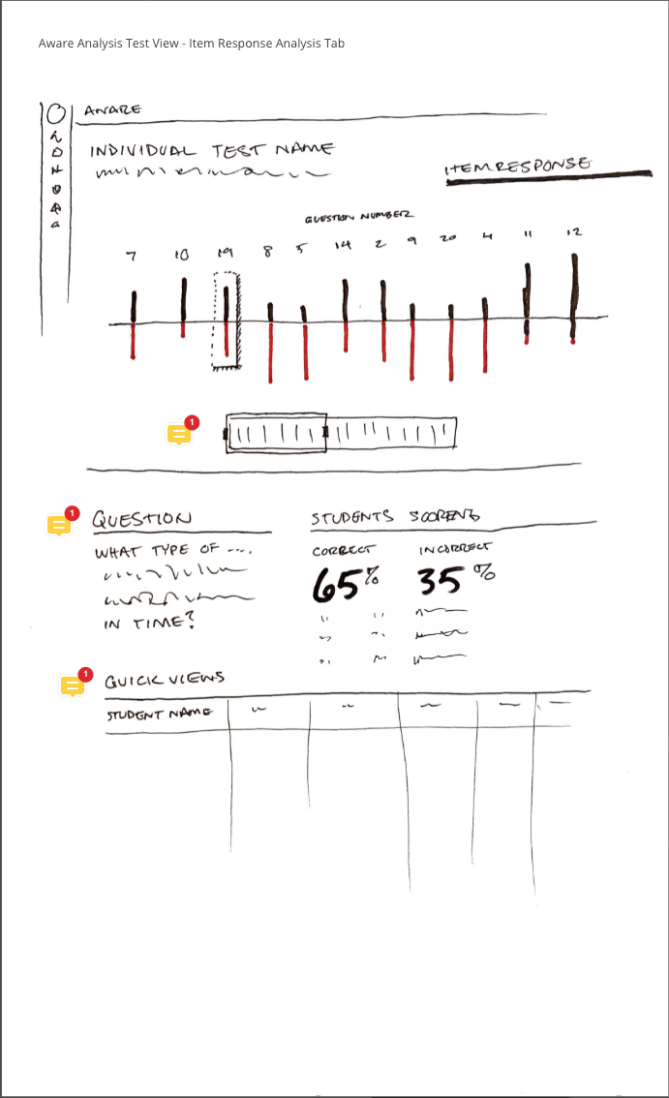
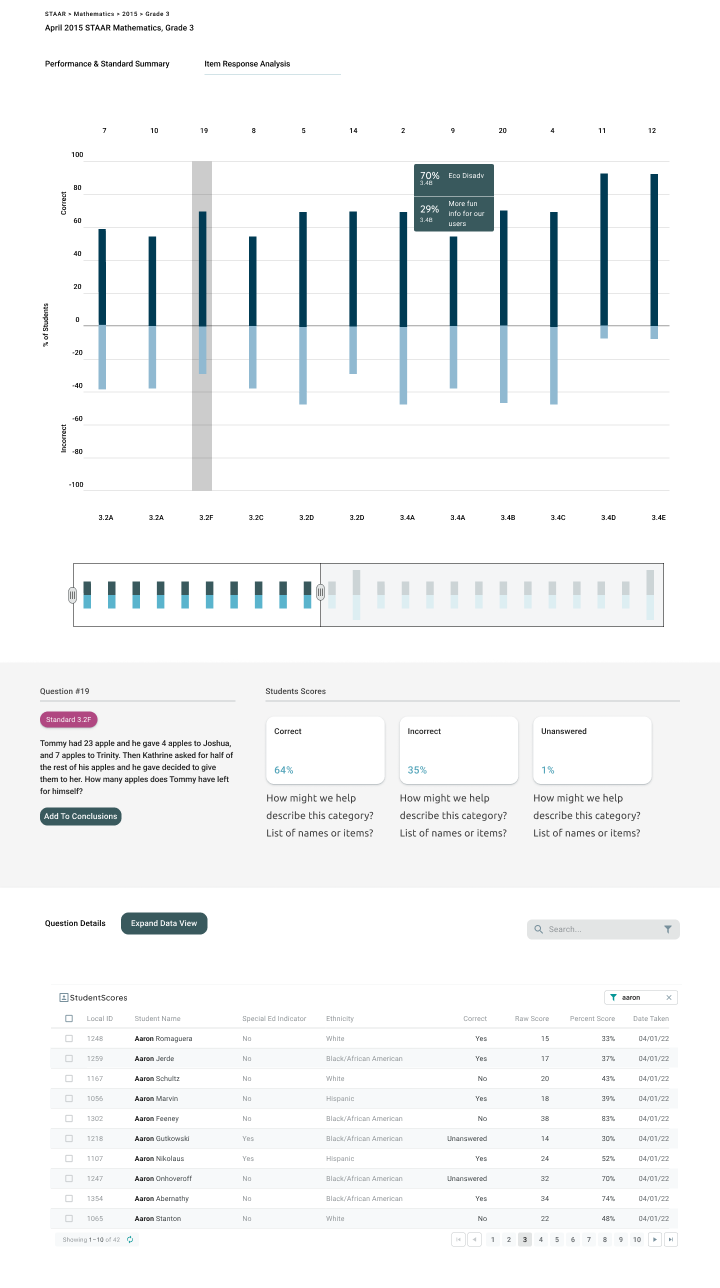
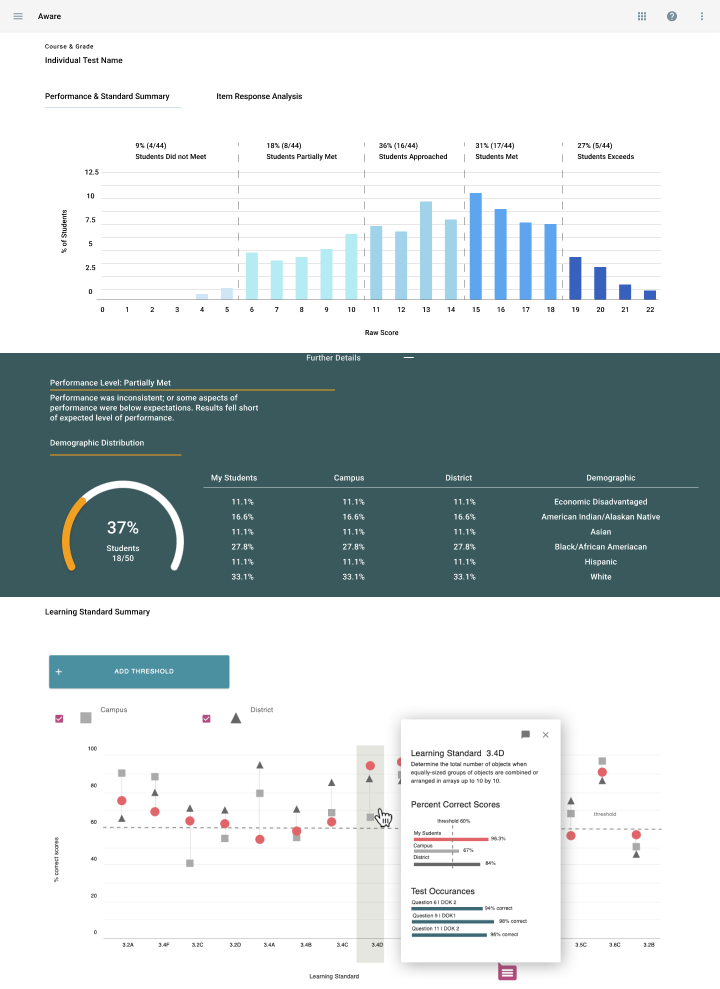
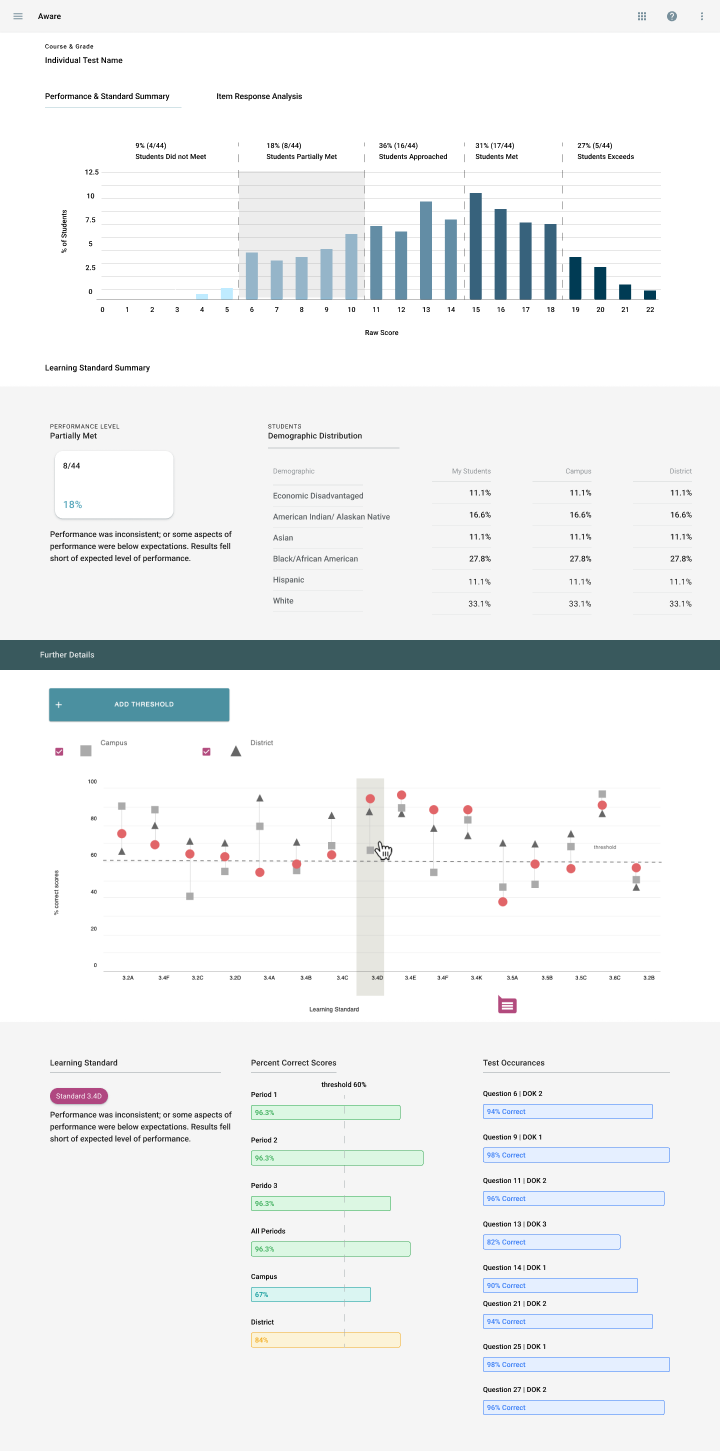
As I began producing multiple iterations of the Single Test Analysis tool, I encountered several significant challenges. The primary issue was that the initial visualizations were not intuitive for users. Initially, we focused on displaying how many students answered questions correctly or incorrectly. However, this approach led us to reconsider the visualization’s priority. Through discussions with users, it became clear that their primary concern was understanding student scores. To address this, I redesigned the visualization to prominently display correct answers, with incorrect answers represented by white space—similar to traditional bar graphs. This approach aligned better with user expectations and provided a clearer view of the data.
Another challenge arose when I attempted to display the number of students in each response category using a paginated format. This approach proved cumbersome, especially for admin users who might need to analyze data for hundreds of students at a time. Realizing the limitations of this design, I decided to revisit and refine my approach.
The final major hurdle involved fitting all the necessary information onto a single page, which resulted in an excessively lengthy scrolling experience. After careful consideration, we decided it would be more effective to break up the information across multiple pages or sections, allowing users to access the data they needed without overwhelming them with too much content at once.
Another challenge arose when I attempted to display the number of students in each response category using a paginated format. This approach proved cumbersome, especially for admin users who might need to analyze data for hundreds of students at a time. Realizing the limitations of this design, I decided to revisit and refine my approach.
The final major hurdle involved fitting all the necessary information onto a single page, which resulted in an excessively lengthy scrolling experience. After careful consideration, we decided it would be more effective to break up the information across multiple pages or sections, allowing users to access the data they needed without overwhelming them with too much content at once.
Final Designs
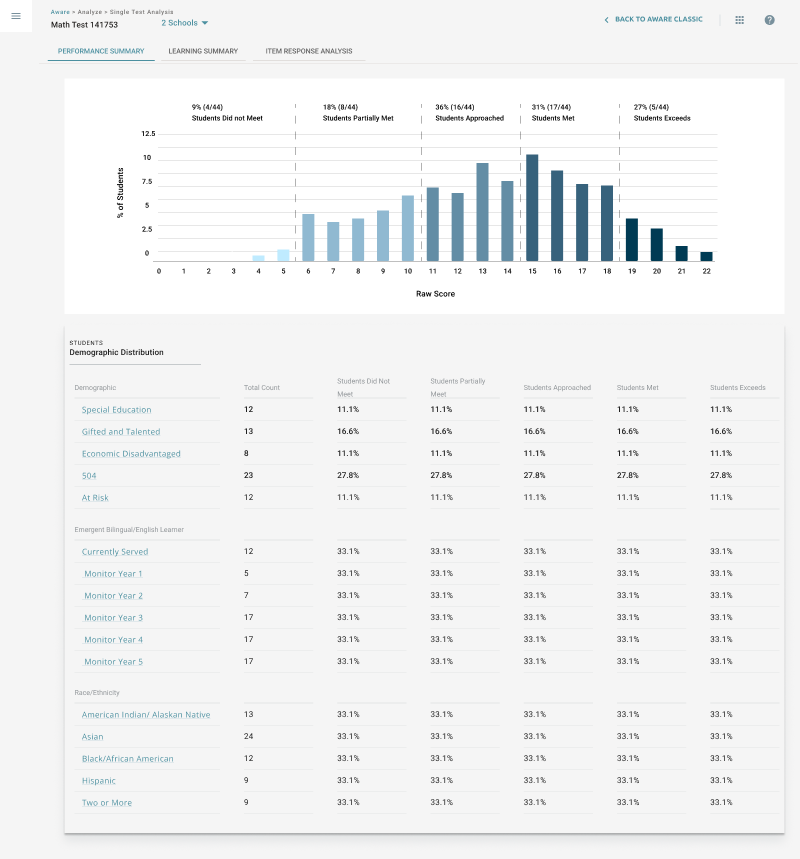
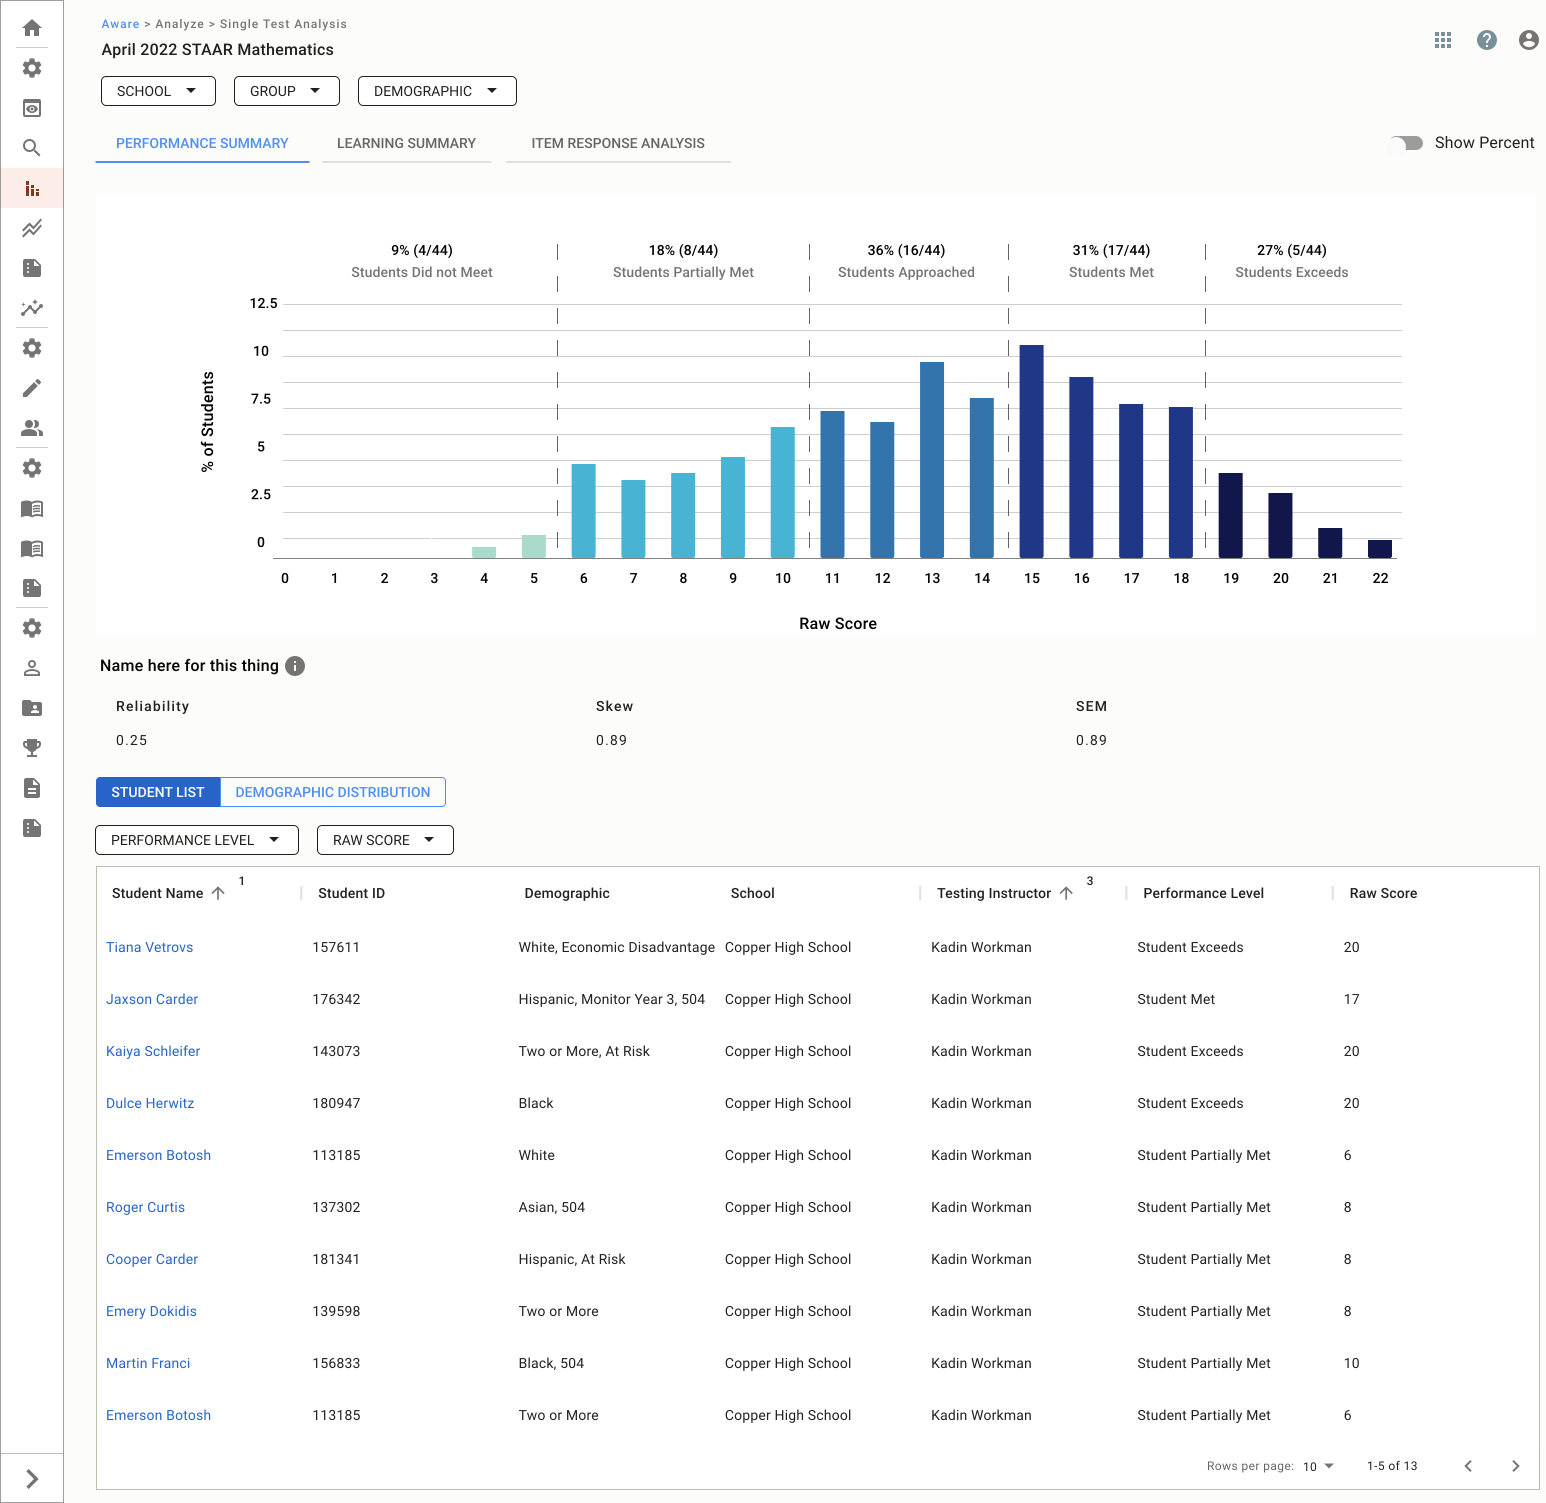
After countless iterations and extensive refinement—far more than can be captured in this case study—we ultimately determined the optimal information architecture for the Single Test Analysis tool. We settled on a structure featuring three tabs that progressively narrow in scope. The first tab, “Performance Summary,” provides a high-level overview of student performance. The second tab, “Standards Summary,” delves into performance relative to educational standards. Finally, the third tab, “Item Response Analysis,” offers granular insights into individual question responses.
This approach not only streamlined the user experience but also ensured that educators and administrators could easily access the specific data they needed, whether for a broad overview or detailed analysis. The process took three 8-week cycles to complete, but the result was a robust and user-friendly product that effectively met the needs of our users.
This approach not only streamlined the user experience but also ensured that educators and administrators could easily access the specific data they needed, whether for a broad overview or detailed analysis. The process took three 8-week cycles to complete, but the result was a robust and user-friendly product that effectively met the needs of our users.
Release and Feedback
The release of Single Test Analysis marked a pivotal moment for our company, as it introduced the premium version of our Aware application—a strategic initiative designed to offer districts advanced tools and capabilities. Released in the summer of 2022, Single Test Analysis was the first of many planned premium features, setting the stage for future innovations.
The feedback from users has been overwhelmingly positive, contributing to significant revenue growth. Thanks to the introduction of Aware Premium tools and the dedicated efforts of our team, we achieved a remarkable 17% year-over-year growth and a 38% increase in product sales. This success was further underscored by the addition of 10 new districts and the return of 3 former districts, all of whom were attracted by the new Single Test Analysis tool.
As we continue to evolve our offerings, we have actively gathered feedback from educators, leading to plans for further enhancements. Teachers have expressed a desire for more detailed student data and advanced statistical analysis features, particularly for staff who are well-versed in analytical language and need to assess the reliability of questions. We are excited to announce that these new features will be rolled out in the fall of 2024, continuing our commitment to meeting the evolving needs of our users.
The feedback from users has been overwhelmingly positive, contributing to significant revenue growth. Thanks to the introduction of Aware Premium tools and the dedicated efforts of our team, we achieved a remarkable 17% year-over-year growth and a 38% increase in product sales. This success was further underscored by the addition of 10 new districts and the return of 3 former districts, all of whom were attracted by the new Single Test Analysis tool.
As we continue to evolve our offerings, we have actively gathered feedback from educators, leading to plans for further enhancements. Teachers have expressed a desire for more detailed student data and advanced statistical analysis features, particularly for staff who are well-versed in analytical language and need to assess the reliability of questions. We are excited to announce that these new features will be rolled out in the fall of 2024, continuing our commitment to meeting the evolving needs of our users.
Conclusion
This project was a significant milestone in my career, providing me with a deep understanding of the design process within a smaller company. Being involved from the initial ideation to the final release of the Single Test Analysis tool allowed me to see the full lifecycle of a product and the impact of my work on real users.
The challenges I faced throughout the project—whether it was refining complex data visualizations or navigating multiple iterations—helped elevate my skills as both a designer and a researcher. This experience not only bolstered my confidence but also reinforced my ability to drive meaningful design solutions from concept to completion. I am proud of the role I played in bringing this product to life and look forward to applying these learnings to future projects.
The challenges I faced throughout the project—whether it was refining complex data visualizations or navigating multiple iterations—helped elevate my skills as both a designer and a researcher. This experience not only bolstered my confidence but also reinforced my ability to drive meaningful design solutions from concept to completion. I am proud of the role I played in bringing this product to life and look forward to applying these learnings to future projects.
Want to work together?
If you like what you see and want to work together, get in touch!
Jojuandelk@gmail.com