EditorMulti Test AnalysisSpace plays · scrolls the page
Multi Test Analysis
Problem
As part of our mission to enhance the data analytics capabilities of our platform, we initially focused on solving the challenges of single test analysis. This success naturally led to a broader question: How can we extend these capabilities to efficiently handle multiple tests? Recognizing the importance of this, I took the lead in conducting user interviews with key administrators who frequently interact with our system. Through these discussions, we uncovered a critical pain point: administrators were spending significant time manually exporting data from our tables into Excel for further manipulation. This process, already time-consuming for a single test, became exponentially more complex with multiple assessments.
Driven by our commitment to improving user experience and efficiency, we decided to tackle this issue head-on. We applied a user-centered design approach to deeply understand the expectations and frustrations of users managing multiple assessments. Our goal was clear: to develop a streamlined solution that would drastically reduce the time spent on data manipulation and enhance overall productivity. The insights gained from these interviews not only guided our design process but also underscored the potential impact of a more integrated and automated analytics solution.
Driven by our commitment to improving user experience and efficiency, we decided to tackle this issue head-on. We applied a user-centered design approach to deeply understand the expectations and frustrations of users managing multiple assessments. Our goal was clear: to develop a streamlined solution that would drastically reduce the time spent on data manipulation and enhance overall productivity. The insights gained from these interviews not only guided our design process but also underscored the potential impact of a more integrated and automated analytics solution.
Research
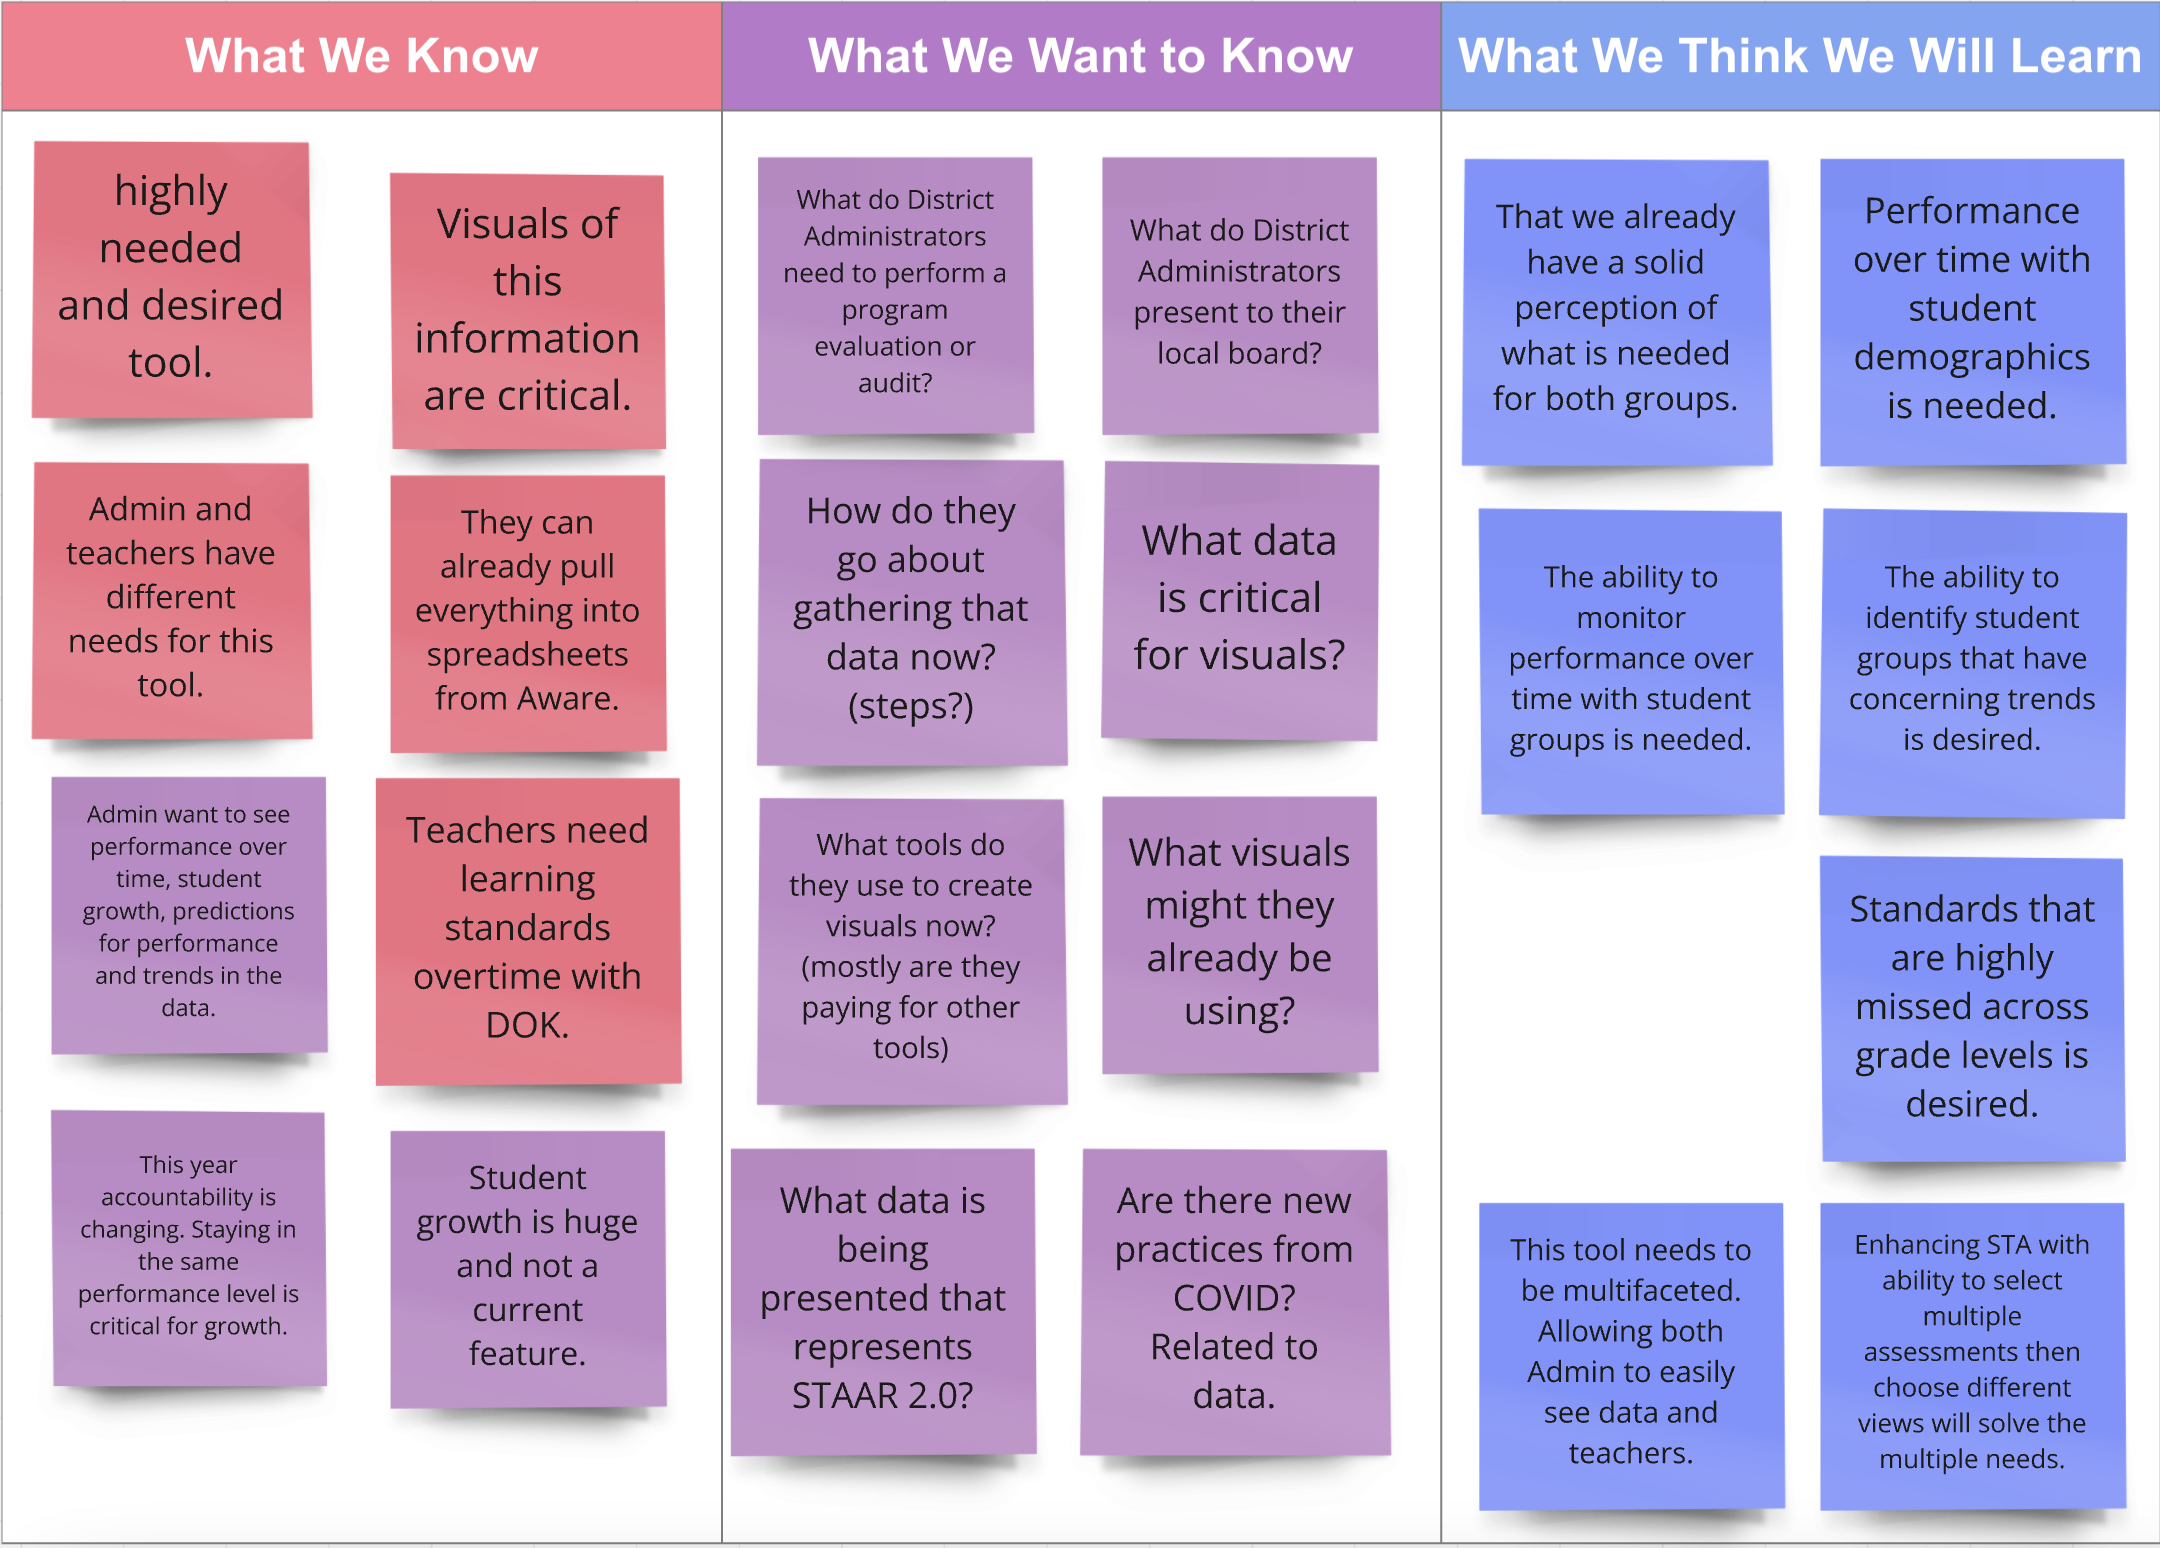
Conducting user research during the summer presented a unique challenge, as many potential interviewees were unavailable. Despite this, we successfully connected with district administrators and campus instructional coaches, supplementing our findings with previously gathered data. Through our diligent efforts, we secured five individual interviews. As the lead facilitator, I conducted each interview, with my project manager assisting by taking detailed notes. This setup allowed me to fully focus on engaging with the interviewees and extracting valuable insights.
To ensure our interviews were as effective as possible, we crafted our questions using the powerful framework of the 5 W’s: Who, What, When, Where, and Why. This method not only guided us in determining the most relevant questions but also helped in organizing the flow and structure of the interviews. By grounding our research in this approach, we were able to uncover crucial information that would inform our design process and address the specific needs of our users.
To ensure our interviews were as effective as possible, we crafted our questions using the powerful framework of the 5 W’s: Who, What, When, Where, and Why. This method not only guided us in determining the most relevant questions but also helped in organizing the flow and structure of the interviews. By grounding our research in this approach, we were able to uncover crucial information that would inform our design process and address the specific needs of our users.
Insights and Synthesis
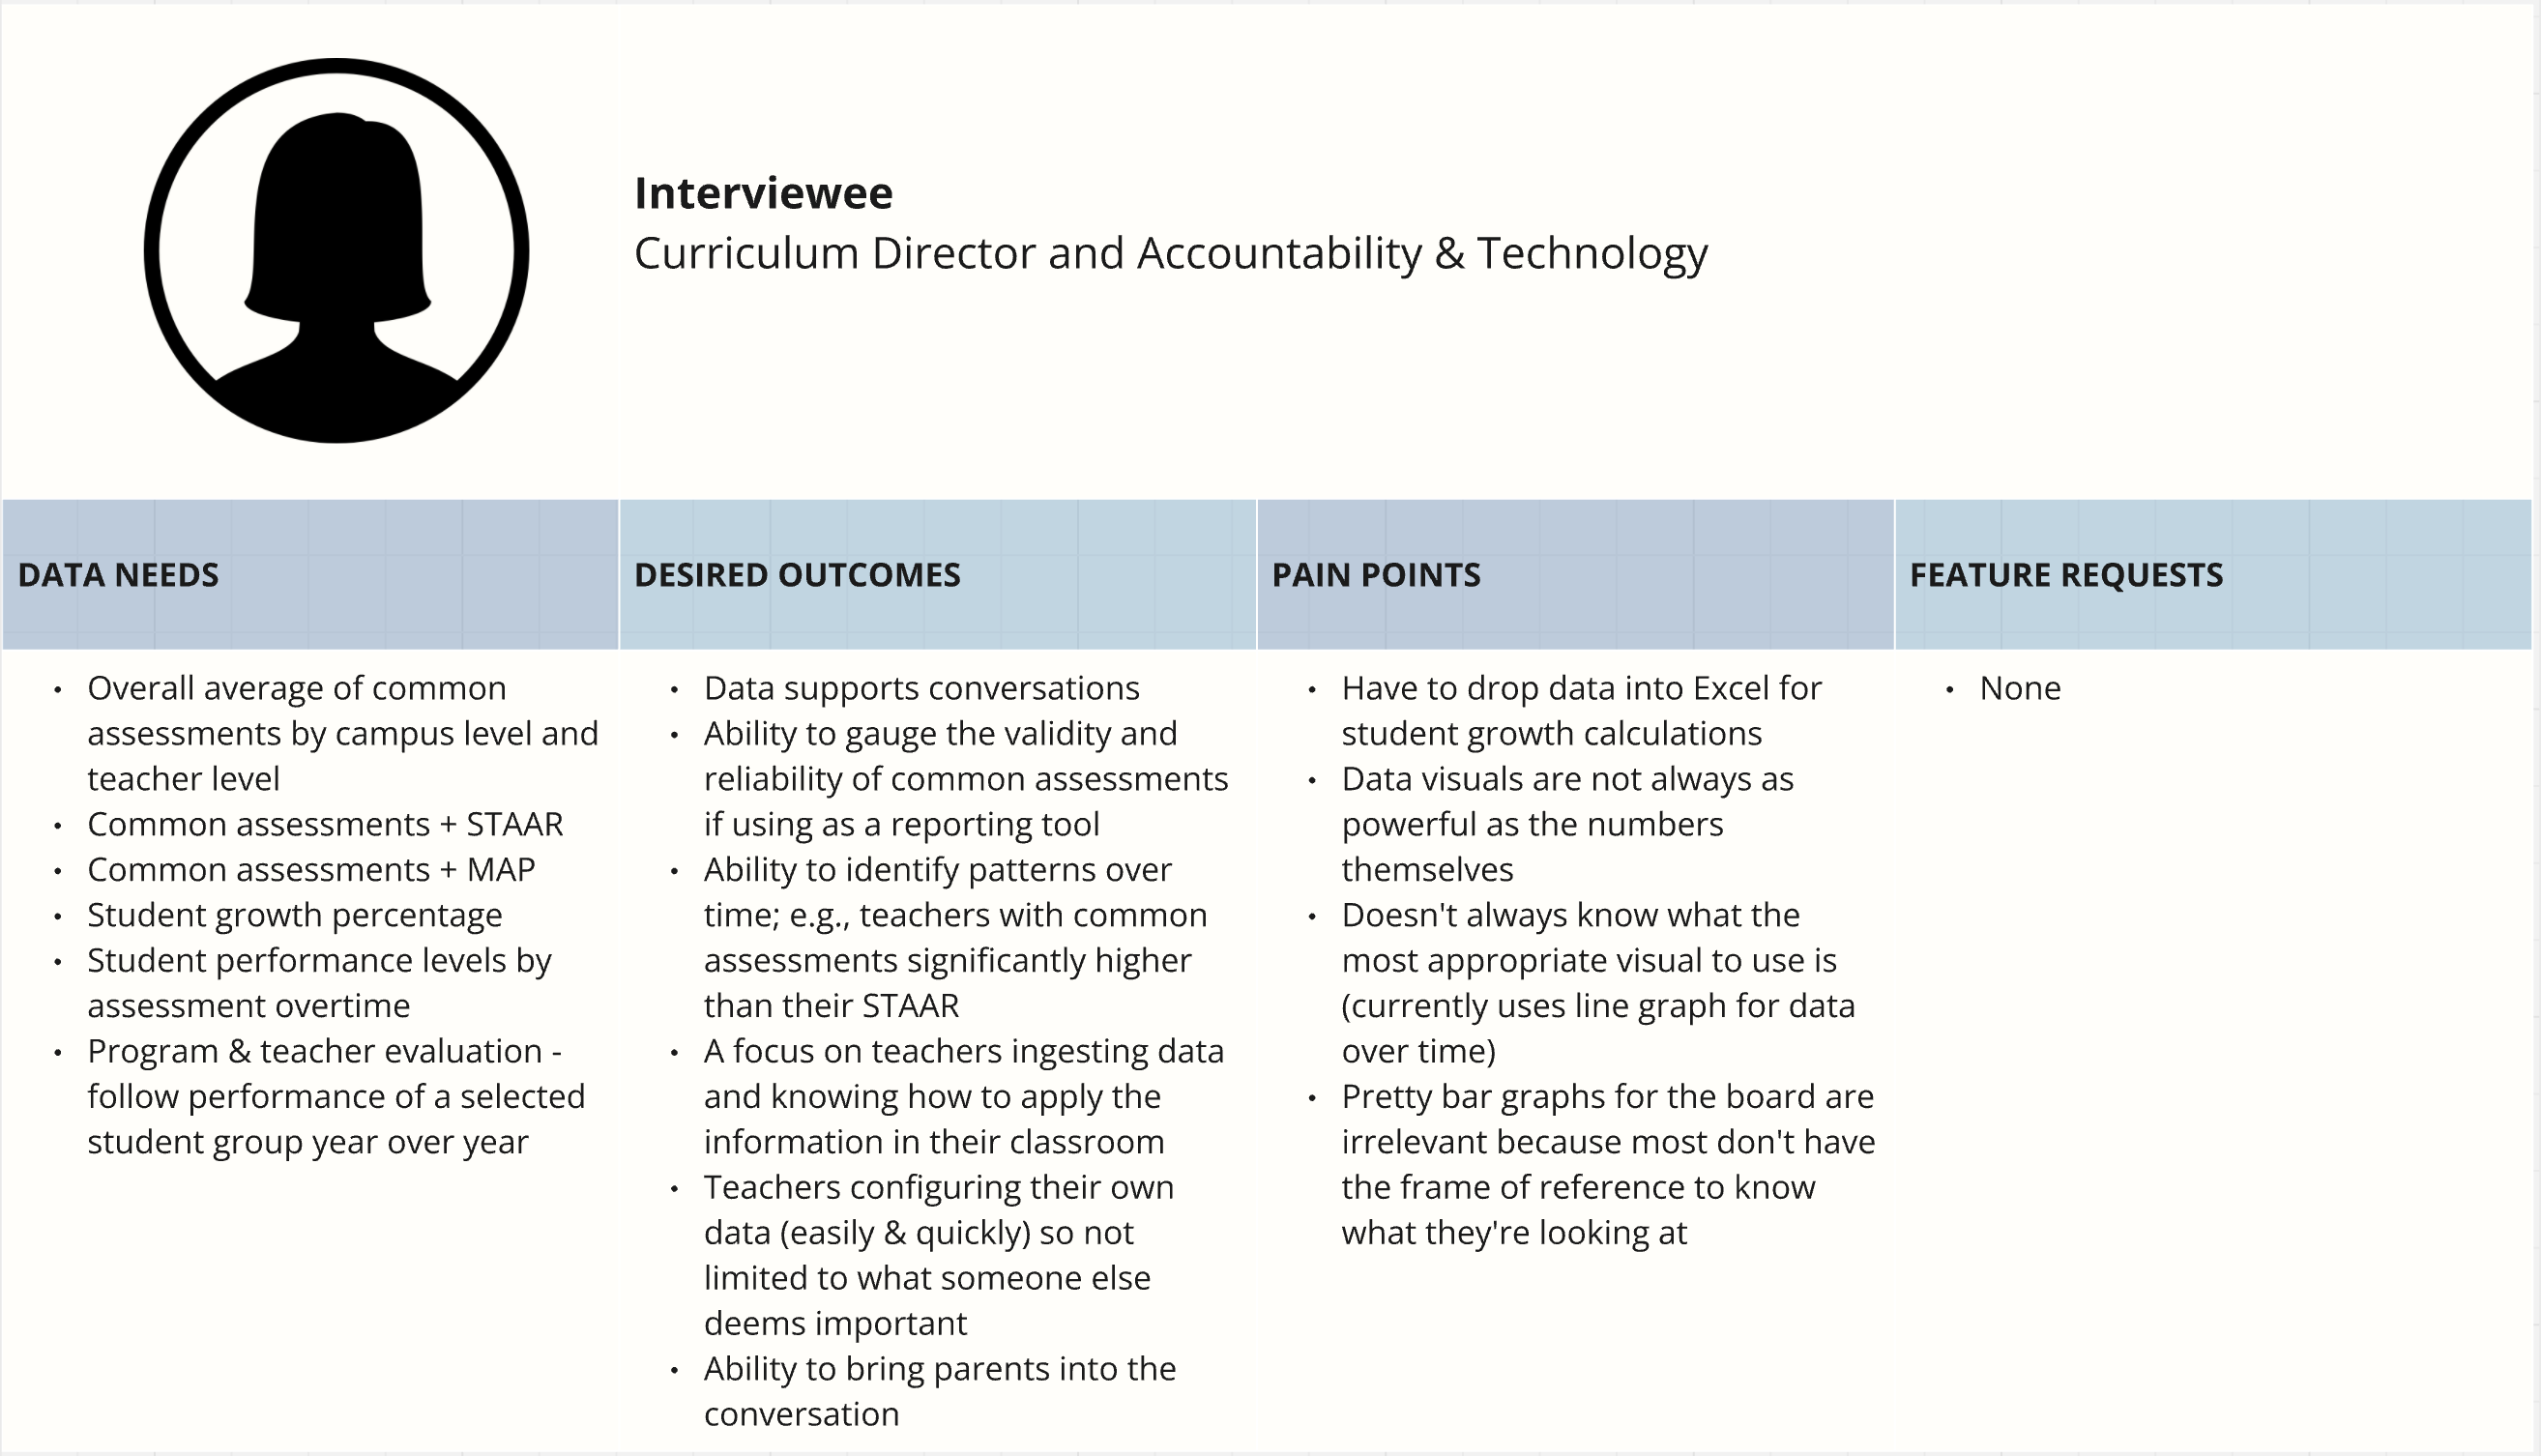
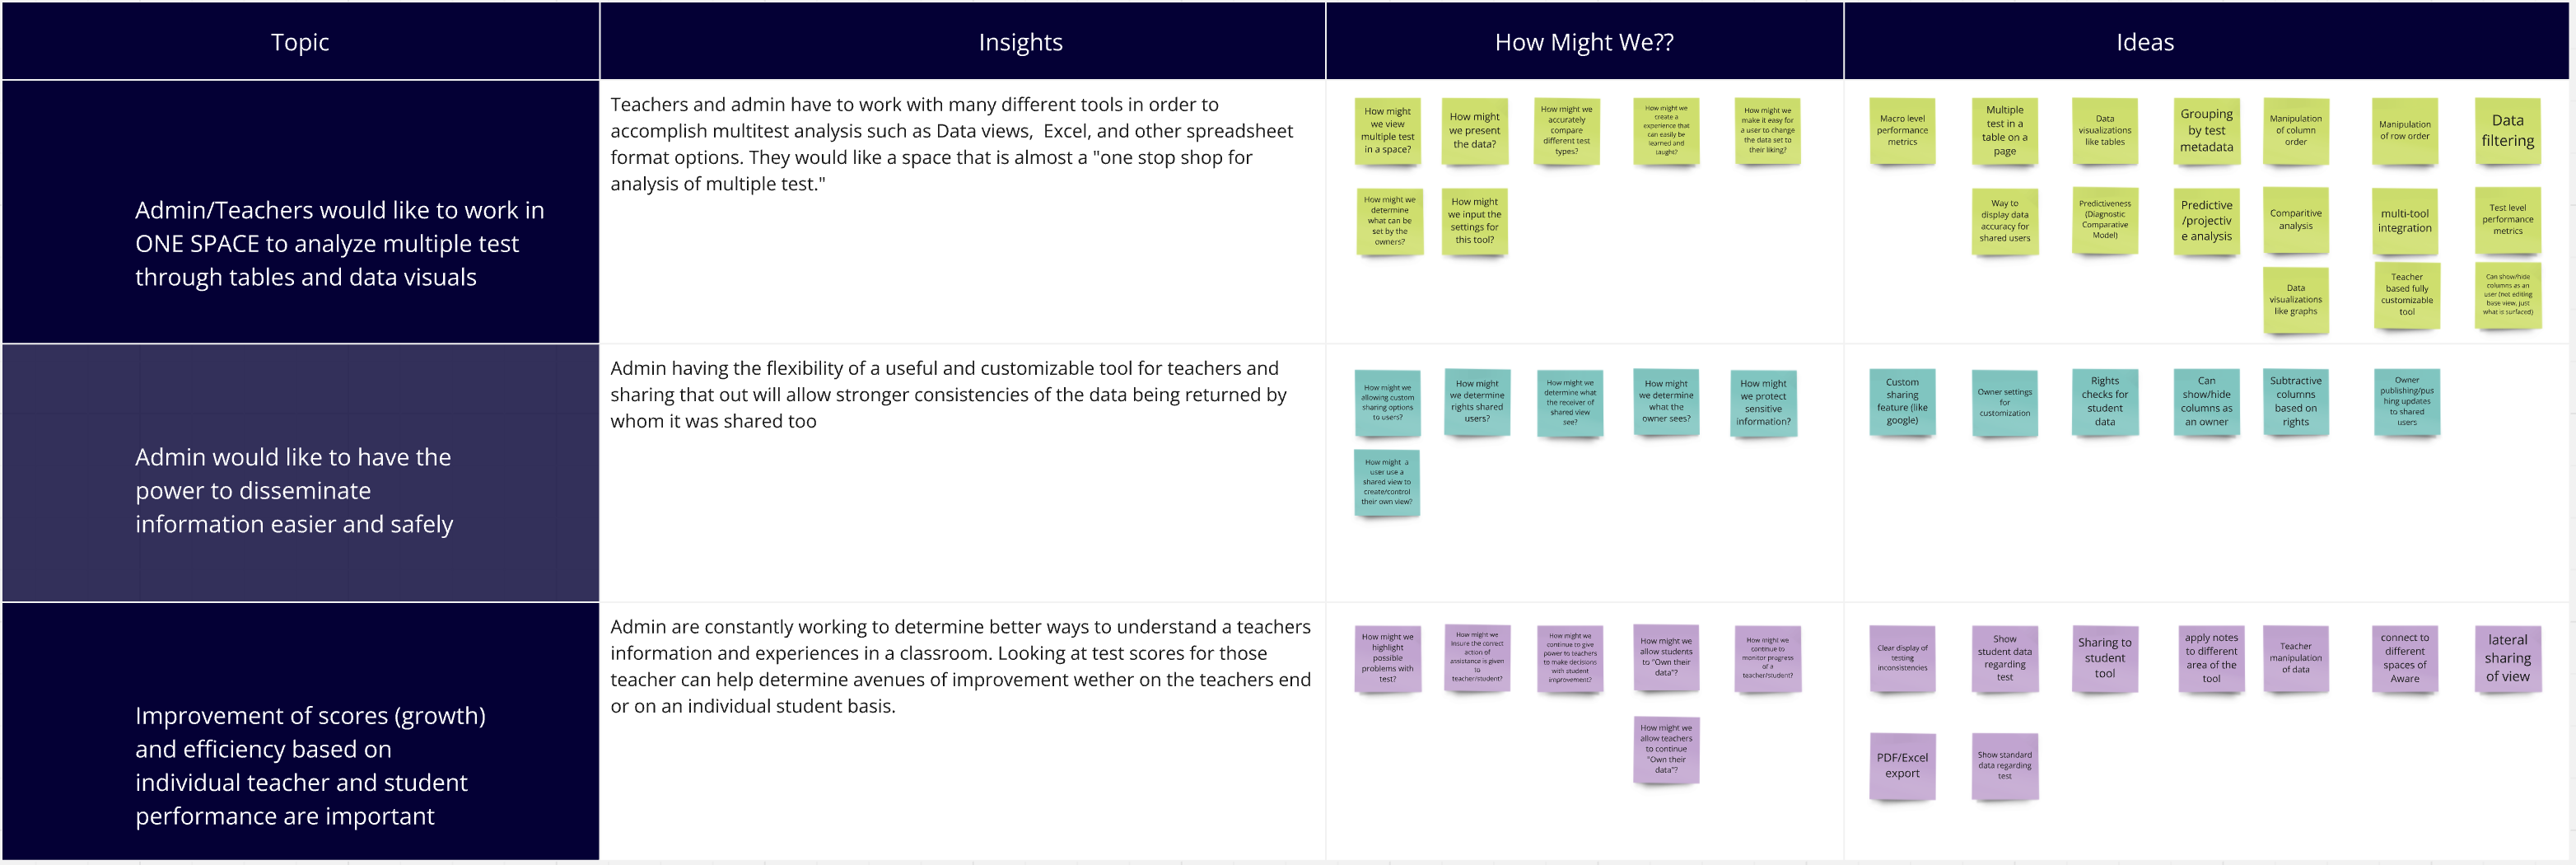
Our interviews with administrators yielded powerful insights, particularly around their current processes and the tools they rely on. They shared detailed examples, including screenshots of custom Excel tools they or their peers had developed to manage and compare assessment data. One of the most significant pain points they highlighted was the time-consuming nature of comparing multiple assessments—it often takes more than half an hour just to align a few. Beyond the simple act of exporting data, they must also create a common scale to accurately compare different types of assessments. This step is crucial, as each assessment type has its own scoring method, requiring administrators to determine the proper metric to maintain data integrity.
A key insight we discovered was the strong desire for our software to consolidate these tasks into a single, integrated space. The administrators expressed frustration with the need to switch between different applications to analyze data, which not only slows down the process but also increases the risk of errors. After painstakingly creating these spreadsheets, they share them with teachers and peers to allow for personalized insights specific to each group of students.
Ultimately, the reason administrators invest so much time and effort in these processes is to identify areas where students need improvement, enabling them to enhance the educational outcomes at their schools. Our challenge was clear: to design a solution that would streamline these tasks, allowing administrators to focus more on interpreting the data and less on manipulating it.
A key insight we discovered was the strong desire for our software to consolidate these tasks into a single, integrated space. The administrators expressed frustration with the need to switch between different applications to analyze data, which not only slows down the process but also increases the risk of errors. After painstakingly creating these spreadsheets, they share them with teachers and peers to allow for personalized insights specific to each group of students.
Ultimately, the reason administrators invest so much time and effort in these processes is to identify areas where students need improvement, enabling them to enhance the educational outcomes at their schools. Our challenge was clear: to design a solution that would streamline these tasks, allowing administrators to focus more on interpreting the data and less on manipulating it.
Setting Scope Using Shape Up Process
Our company follows a structured process to manage projects effectively, breaking them into smaller 8-week cycles to ensure better control and timely delivery. For this particular project, our team was allocated four cycles to build the tool. To determine the features that would be developed within this timeframe, we employed the Shape Up method, which guided us in setting a clear and focused scope.
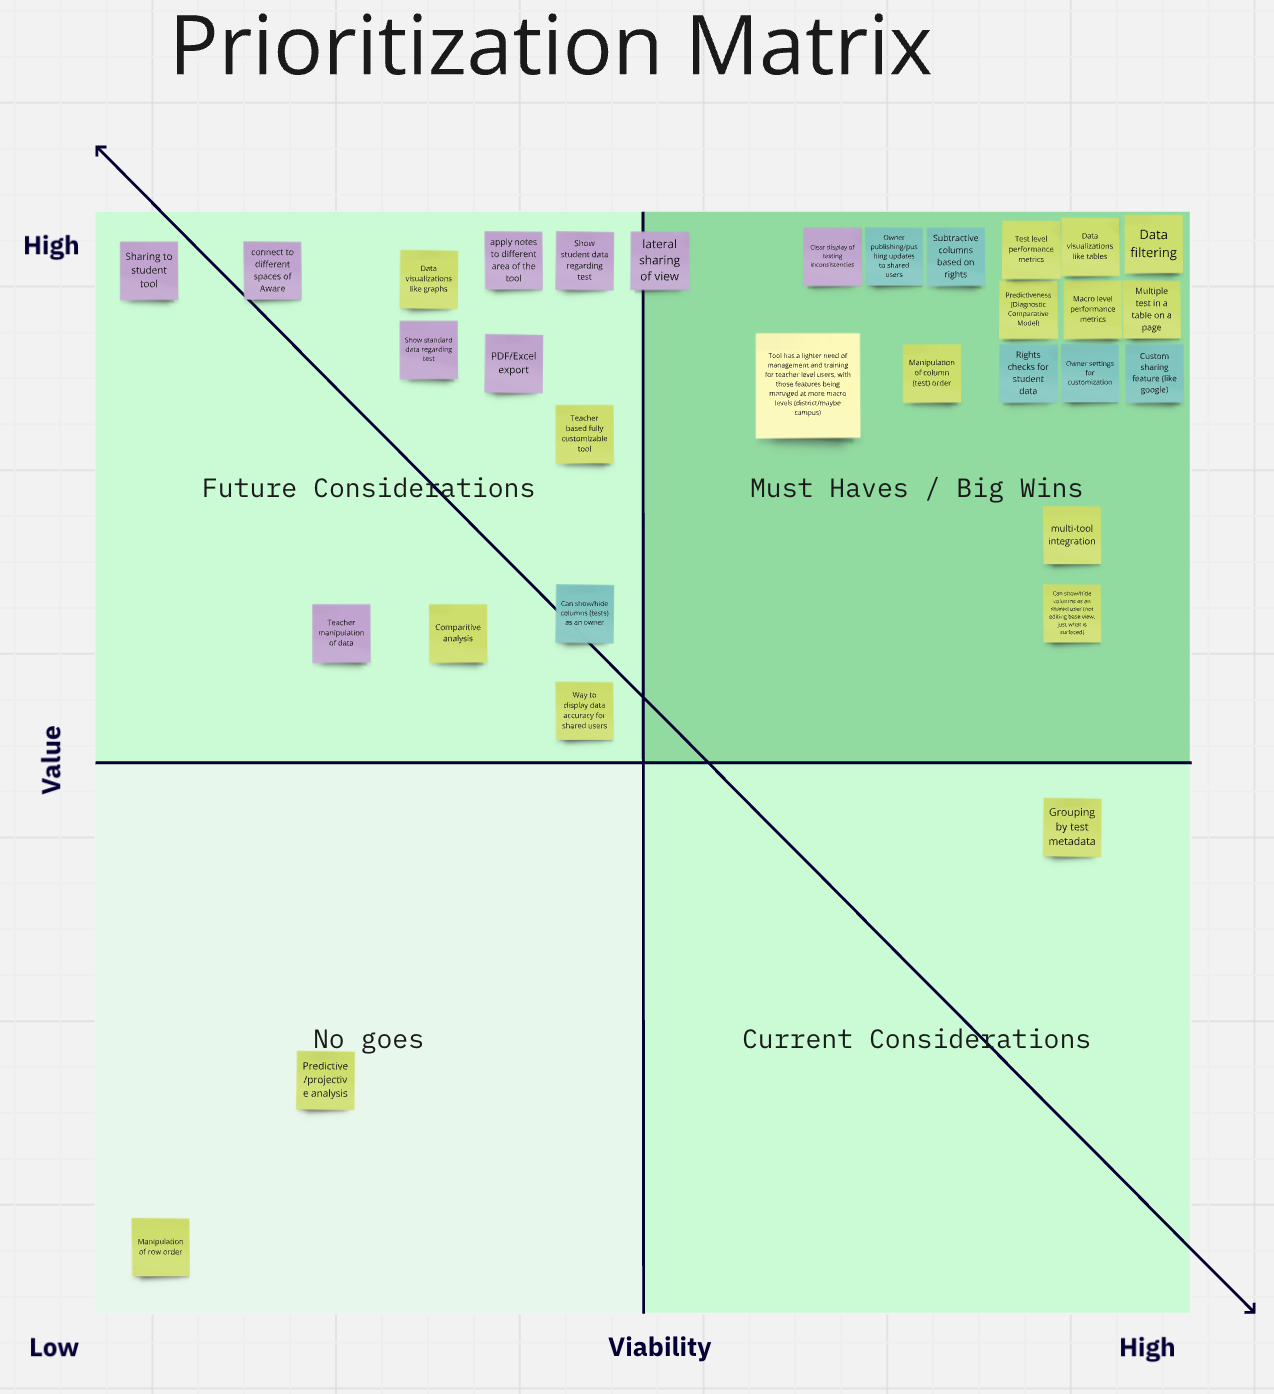
We began by creating a prioritization matrix to differentiate between “must-have” features and those that were “nice to have.” This exercise was crucial in establishing the acceptance criteria for the project. Among the must-haves were key functionalities such as the ability to compare multiple assessments and view data at various levels, from the district down to individual students. This multi-level data visibility was essential for ensuring that all levels of analysts—from district administrators to teachers—could access cohesive information. This, in turn, would facilitate effective communication and enable timely interventions to support student success.
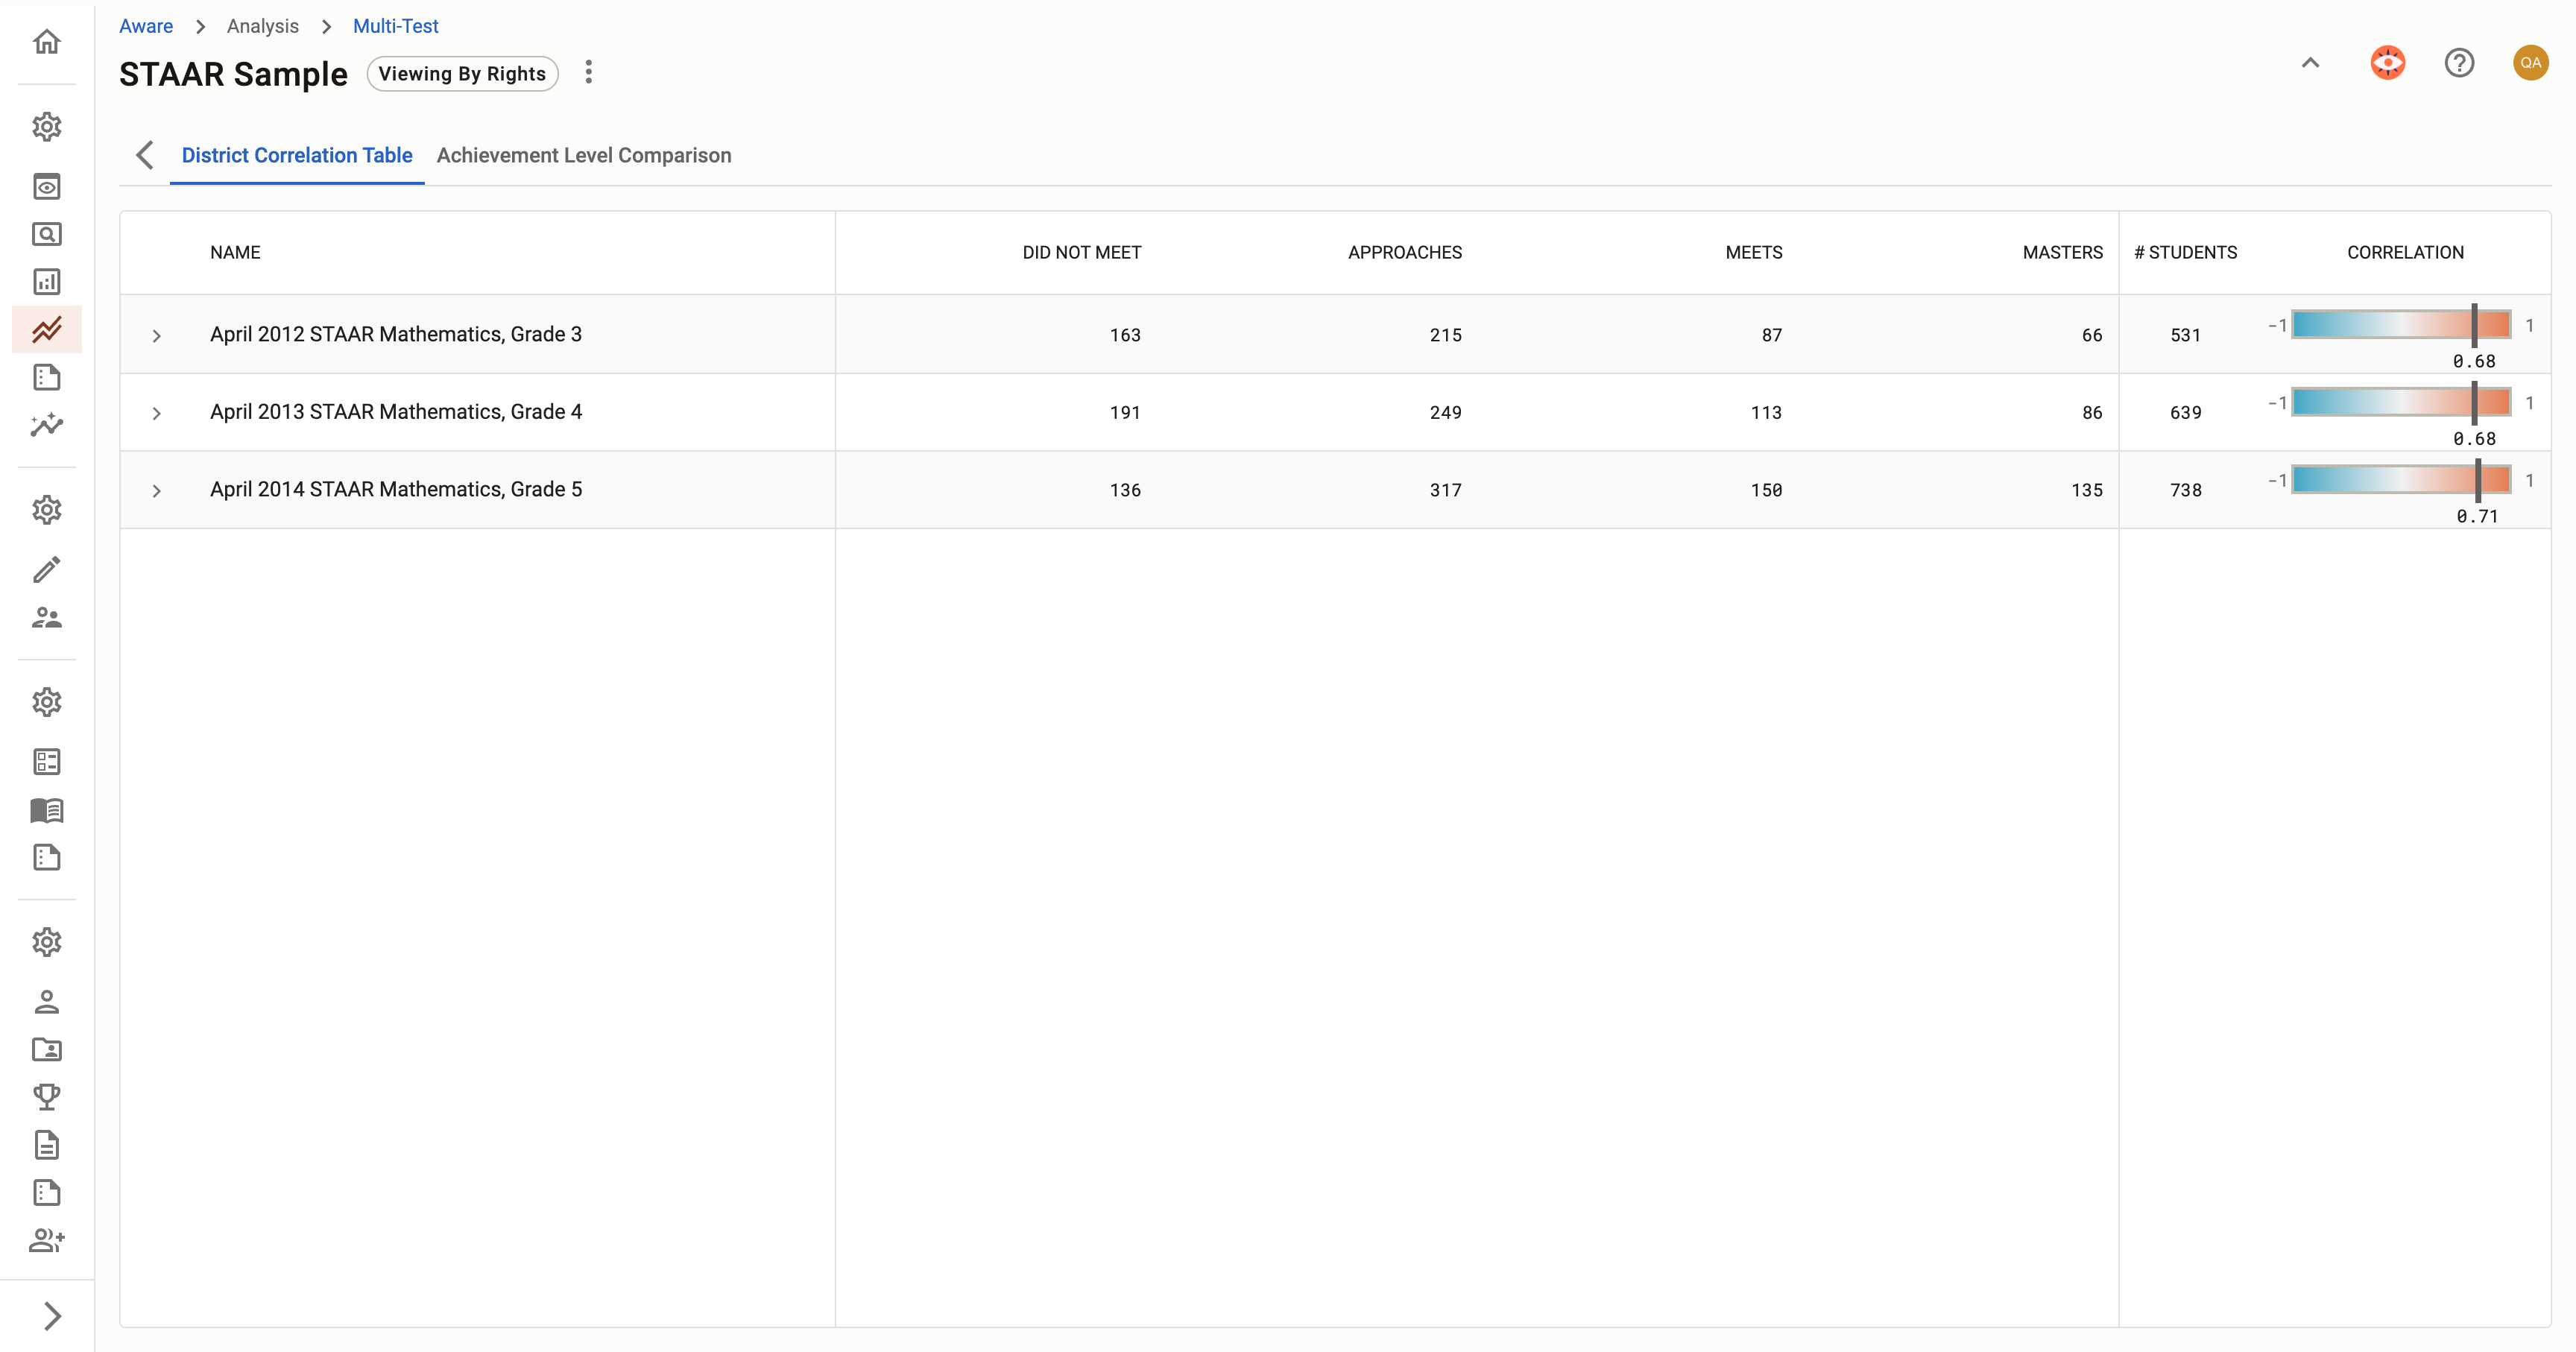
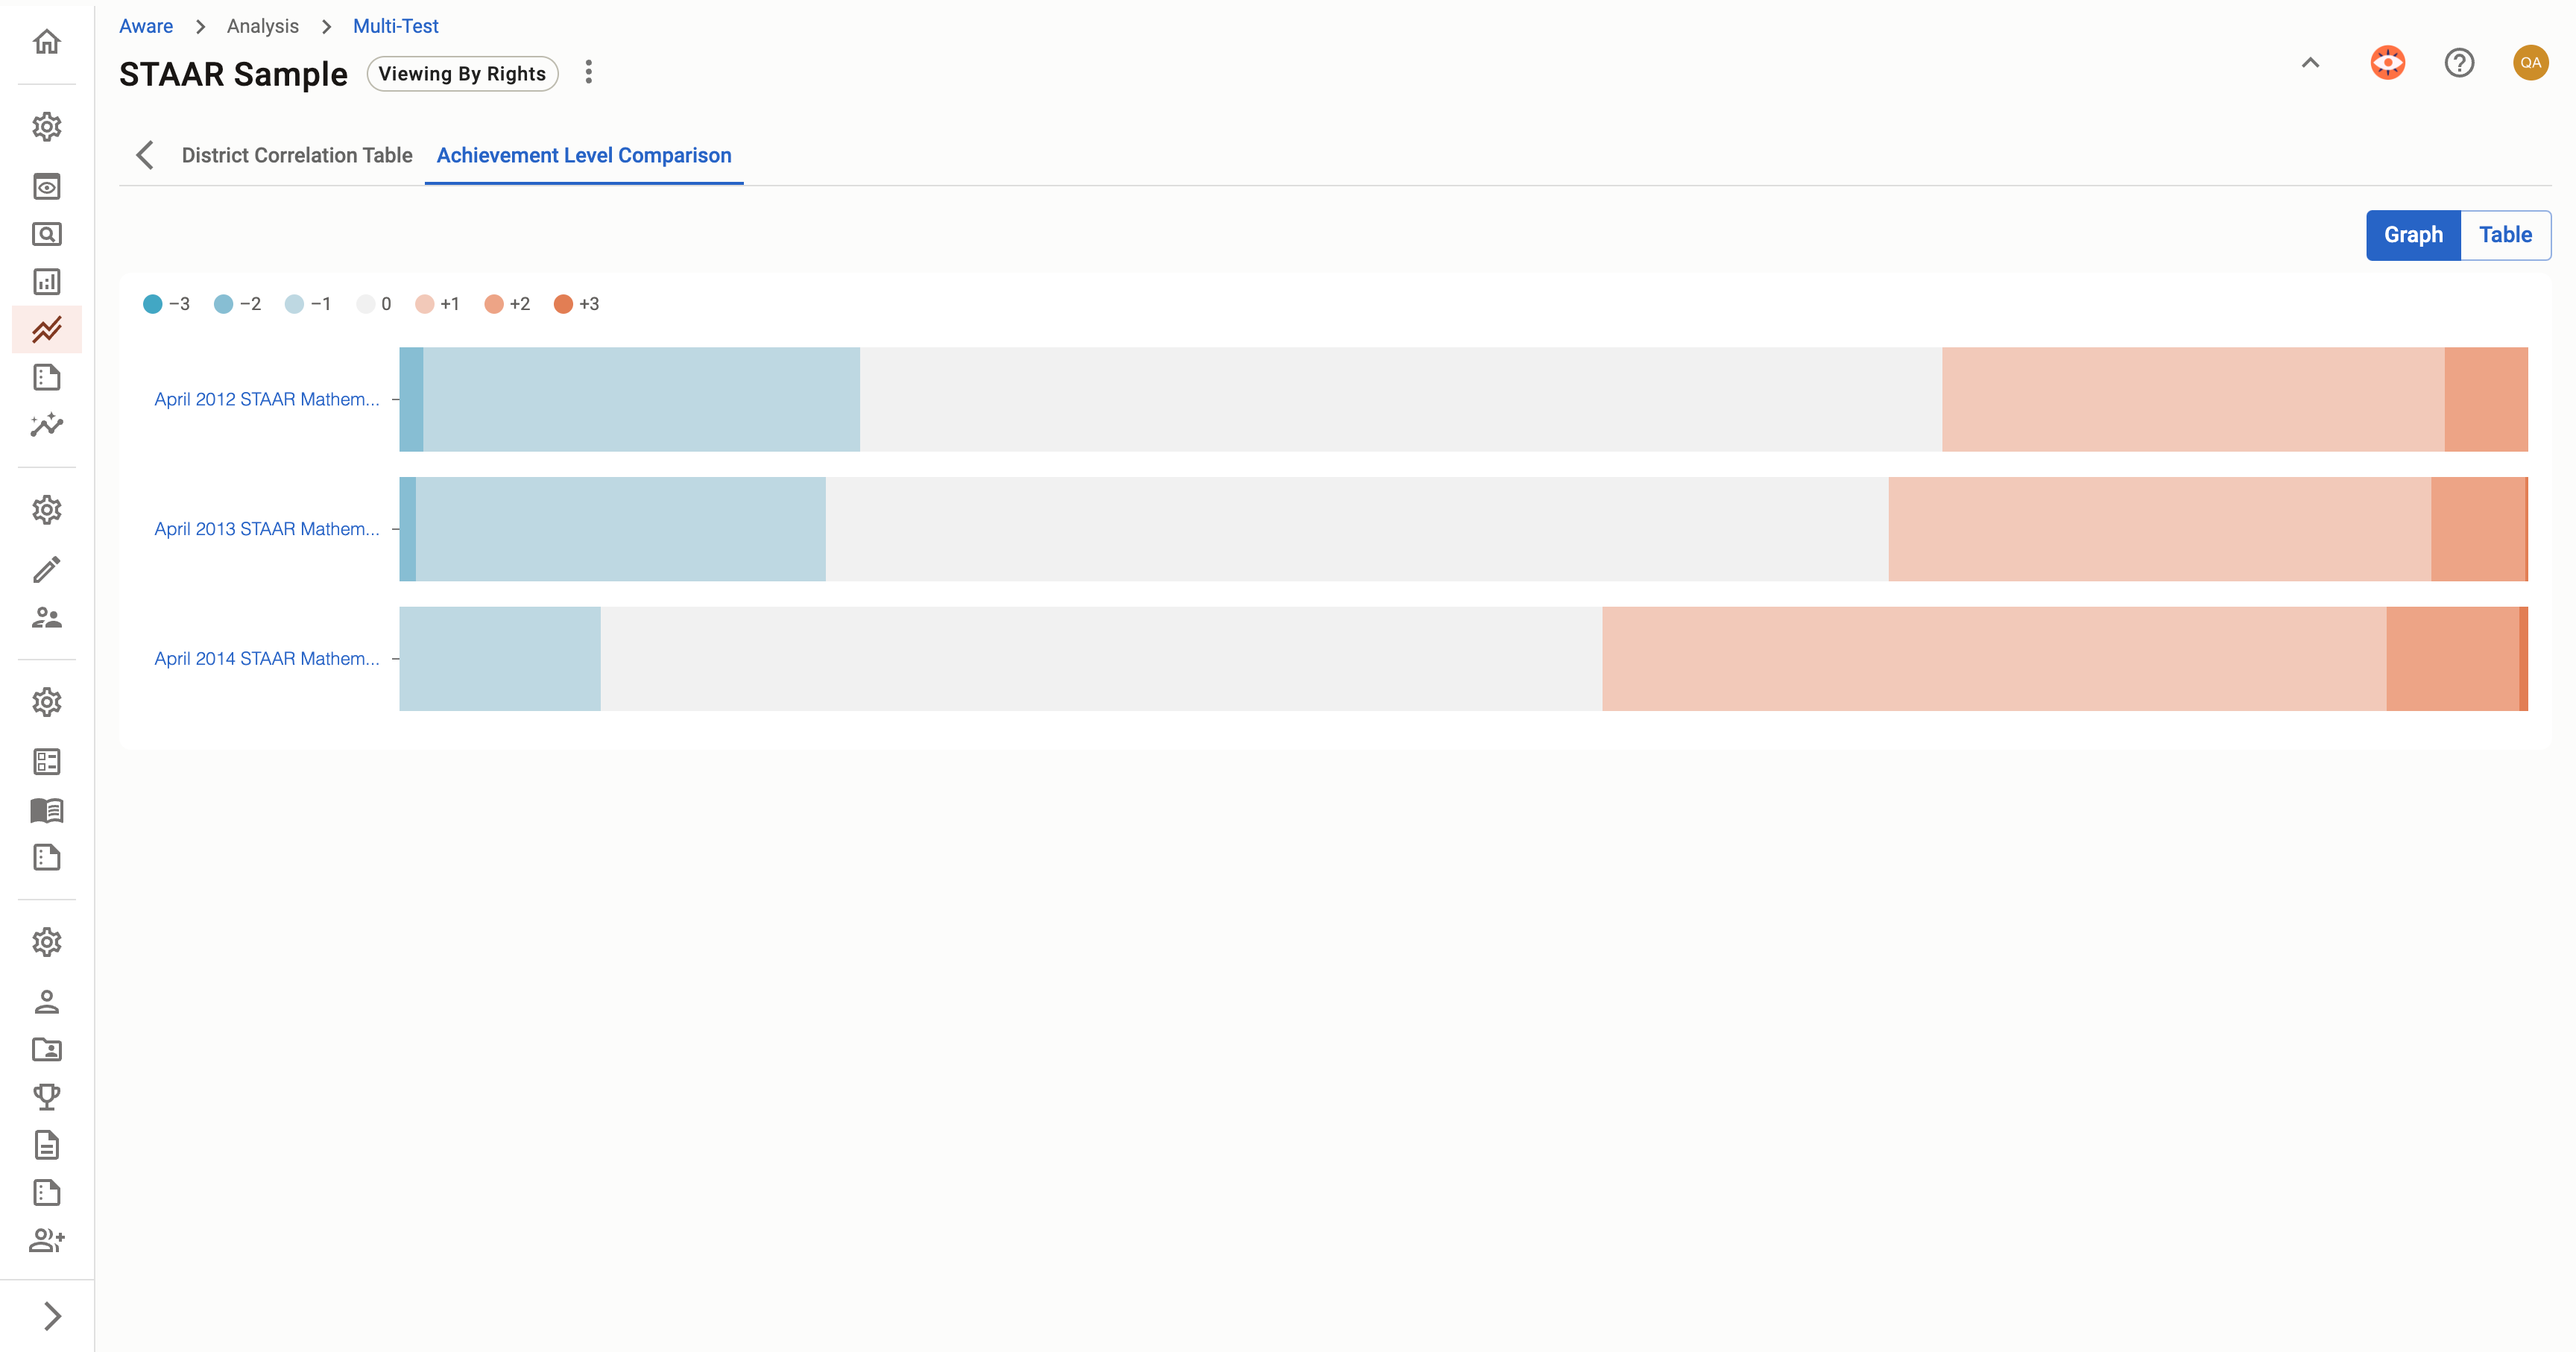
In addition to the core features, we identified an opportunity to add extra value, thanks to the insights provided by our project managers, who brought their extensive experience in education to the table. We decided that the Multi-Test tool would benefit from the inclusion of advanced statistical information, such as correlation analysis. This feature would allow users to set a single assessment as a baseline and compare others against it, providing deeper insights into student performance and highlighting similarities in score distributions. This added functionality was designed to offer a more granular, test-by-test analysis, empowering users to make more informed decisions based on comprehensive data.
We began by creating a prioritization matrix to differentiate between “must-have” features and those that were “nice to have.” This exercise was crucial in establishing the acceptance criteria for the project. Among the must-haves were key functionalities such as the ability to compare multiple assessments and view data at various levels, from the district down to individual students. This multi-level data visibility was essential for ensuring that all levels of analysts—from district administrators to teachers—could access cohesive information. This, in turn, would facilitate effective communication and enable timely interventions to support student success.
In addition to the core features, we identified an opportunity to add extra value, thanks to the insights provided by our project managers, who brought their extensive experience in education to the table. We decided that the Multi-Test tool would benefit from the inclusion of advanced statistical information, such as correlation analysis. This feature would allow users to set a single assessment as a baseline and compare others against it, providing deeper insights into student performance and highlighting similarities in score distributions. This added functionality was designed to offer a more granular, test-by-test analysis, empowering users to make more informed decisions based on comprehensive data.
Acceptance Criteria
- Allow district level admin to configure test types and performance bands for each (for comparison views)
- Generate a data table with varying test types
- Behavior with settings to control who sees each view
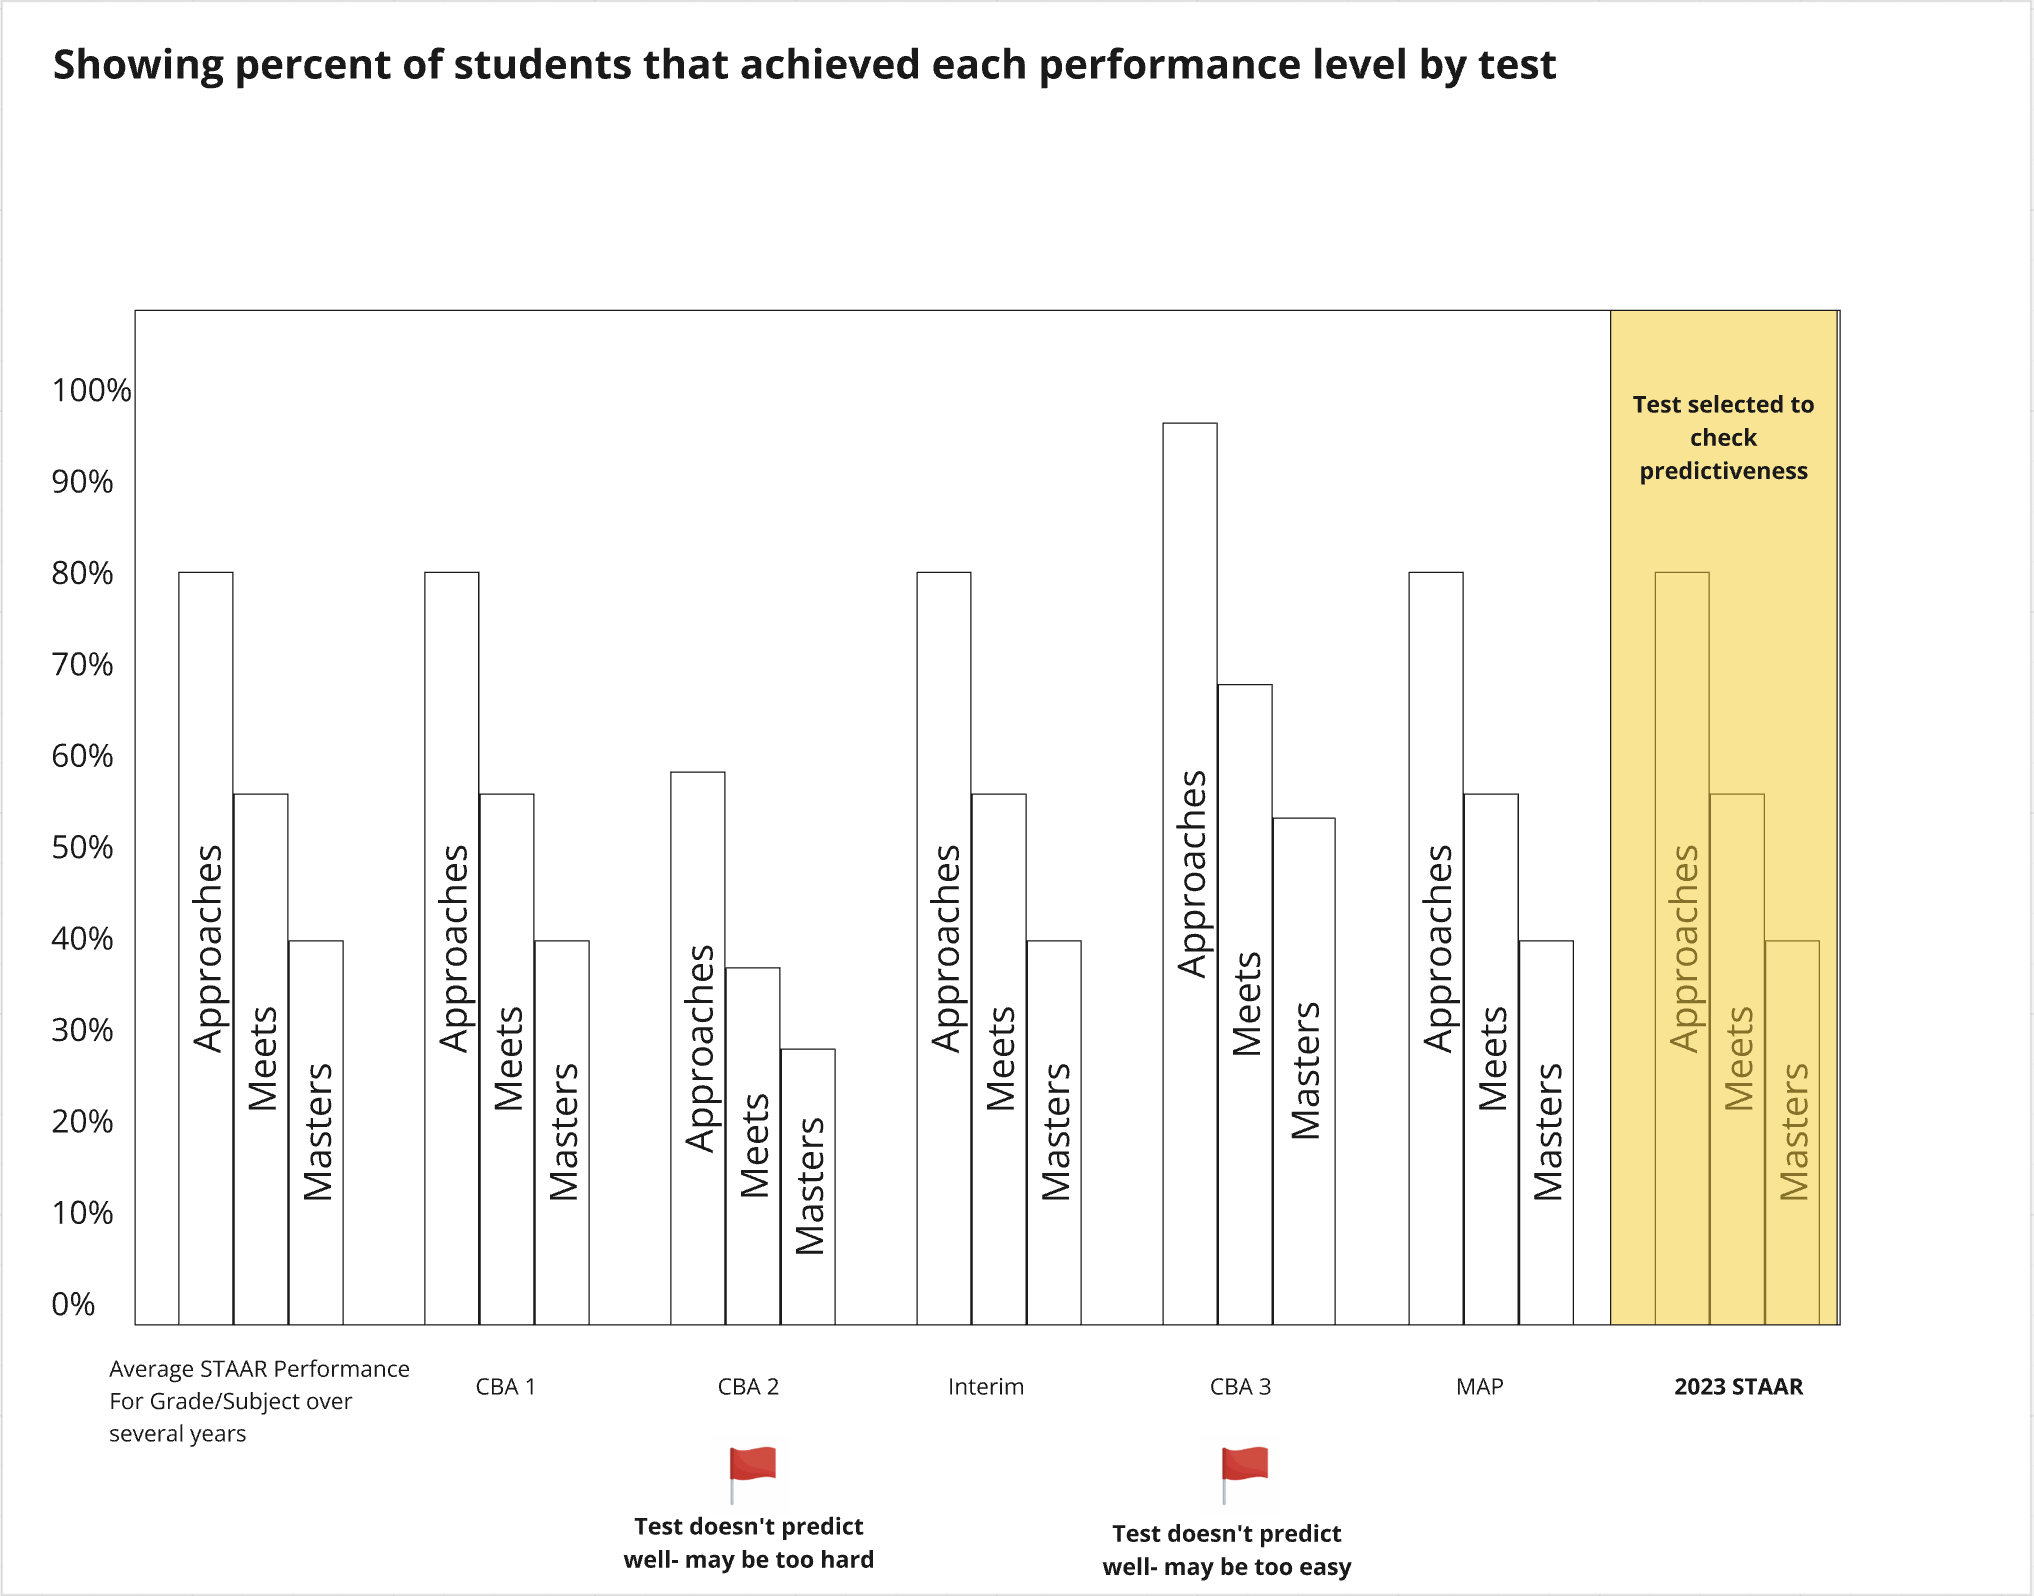
- Select a summative test to compare against to draw conclusions on predictiveness of the other assessments
- View is filterable by student groups
- Visualizations - make the data as approachable and consumable as possible
- Selecting campuses should be possible to narrow in and only show specific campuses. This would only affect certain users with high enough level rights
- Adding demographics should come in and look like it does in quick views under a campus or under a teacher, but they are added via a filter in the UI without having to go to an edit button.
- There should be buttons to toggle between a district, campus, teacher, and student view
Design
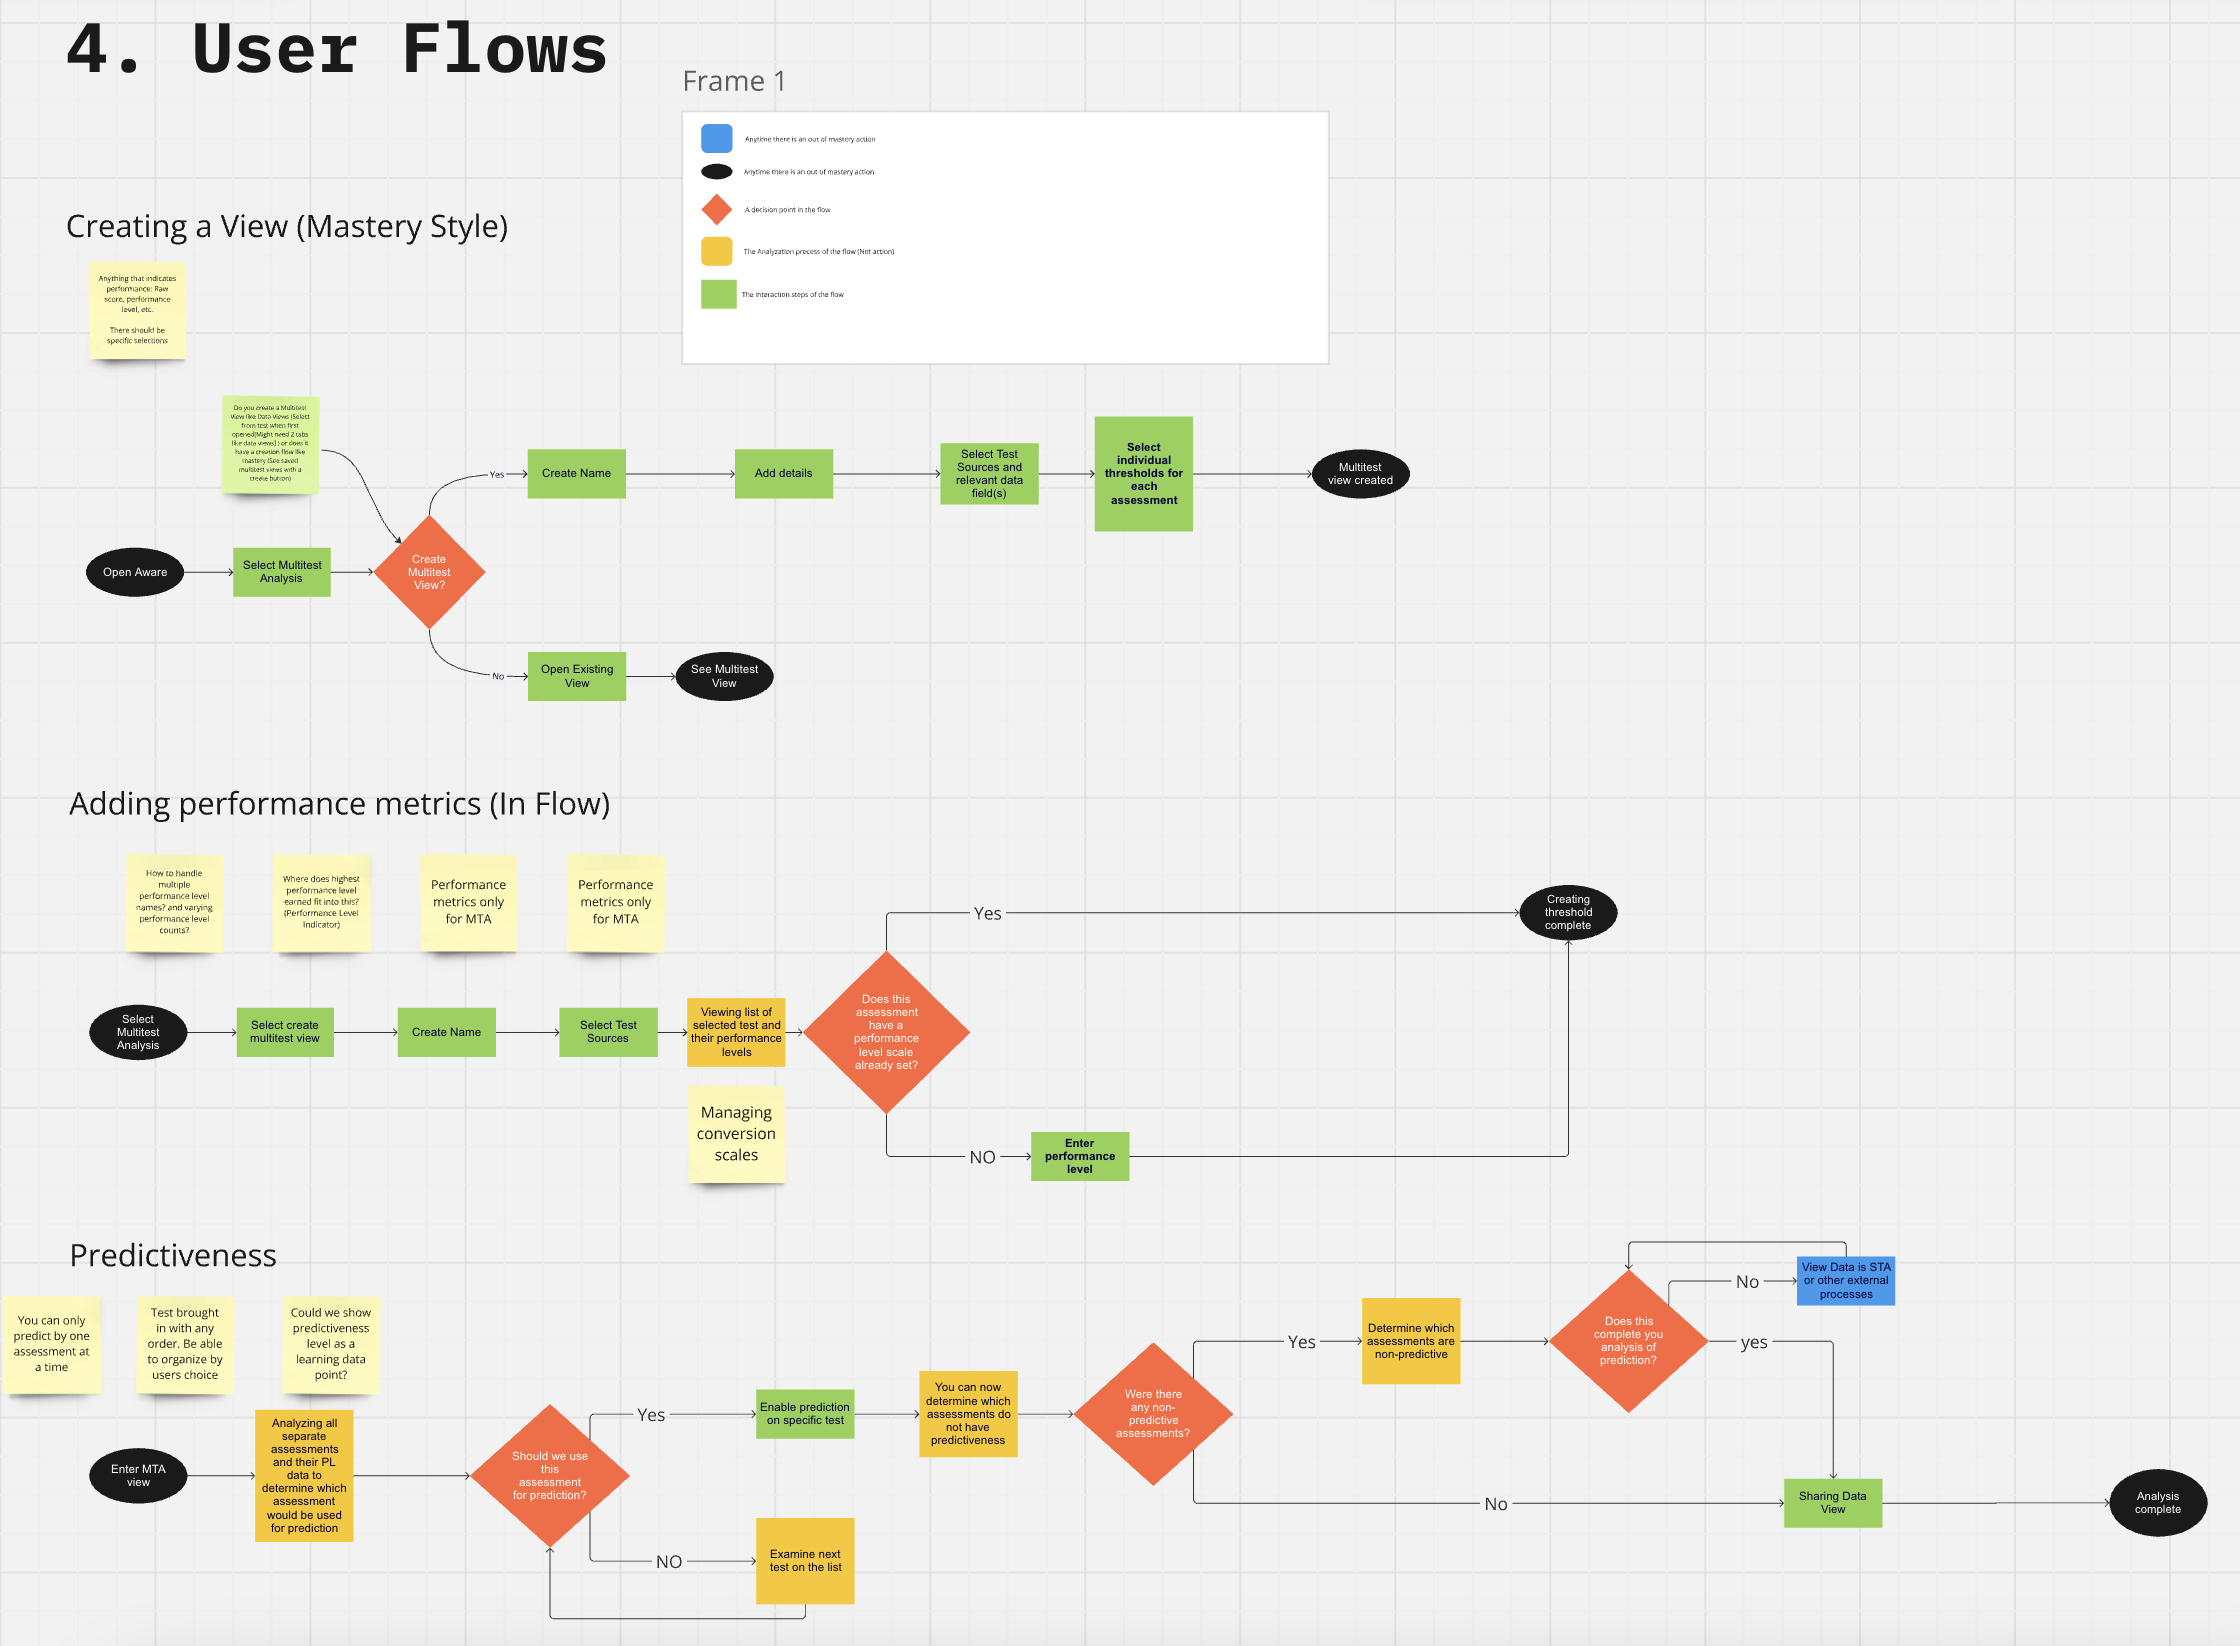
This project presented the most complex challenge I’ve faced to date, especially compared to previous projects that dealt with more straightforward datasets. To ensure a thoroughly thought-out process and avoid unnecessary backtracking, I began by creating detailed user flows. These flows mapped out the entire user journey, highlighting key decision points and actions. This approach allowed us to anticipate potential issues and streamline the interaction flow.
After developing these user flows, I walked the team through each step, ensuring that everyone had a solid understanding of how the tool would function. This collaborative review was crucial in identifying the necessary screens and interactions to bring our vision to life. By taking this methodical approach, we were able to design a solution that not only addressed the complexity of the data but also provided a seamless experience for the user.
After developing these user flows, I walked the team through each step, ensuring that everyone had a solid understanding of how the tool would function. This collaborative review was crucial in identifying the necessary screens and interactions to bring our vision to life. By taking this methodical approach, we were able to design a solution that not only addressed the complexity of the data but also provided a seamless experience for the user.

Iterations
Our extensive research laid the groundwork for highly effective conversations during the design process, enabling us to move through iterations more swiftly and efficiently. With a clear objective in mind—to compare multiple assessments across district, school, and student levels—we developed a setup wizard as a central feature. This wizard allows users to easily select the assessments and metrics they wish to analyze.
This solid foundation, informed by our deep understanding of user needs, allowed us to refine and iterate on our design with confidence. Each iteration brought us closer to a solution that was not only functional but also intuitive, ensuring that our tool would meet the diverse needs of administrators and educators at every level.
This solid foundation, informed by our deep understanding of user needs, allowed us to refine and iterate on our design with confidence. Each iteration brought us closer to a solution that was not only functional but also intuitive, ensuring that our tool would meet the diverse needs of administrators and educators at every level.
Bar Chart to Stacked Bars
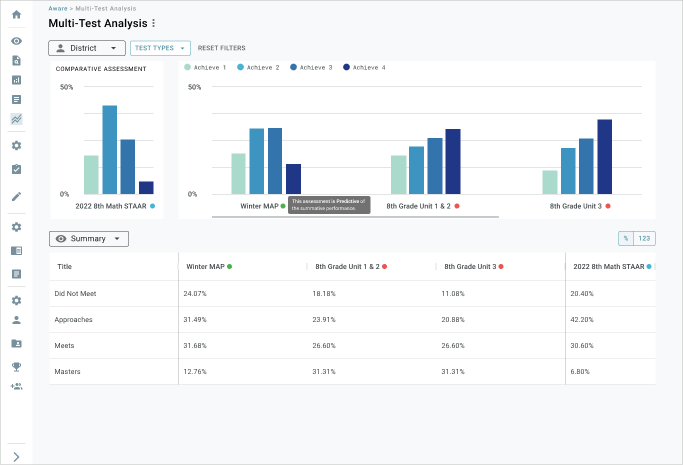
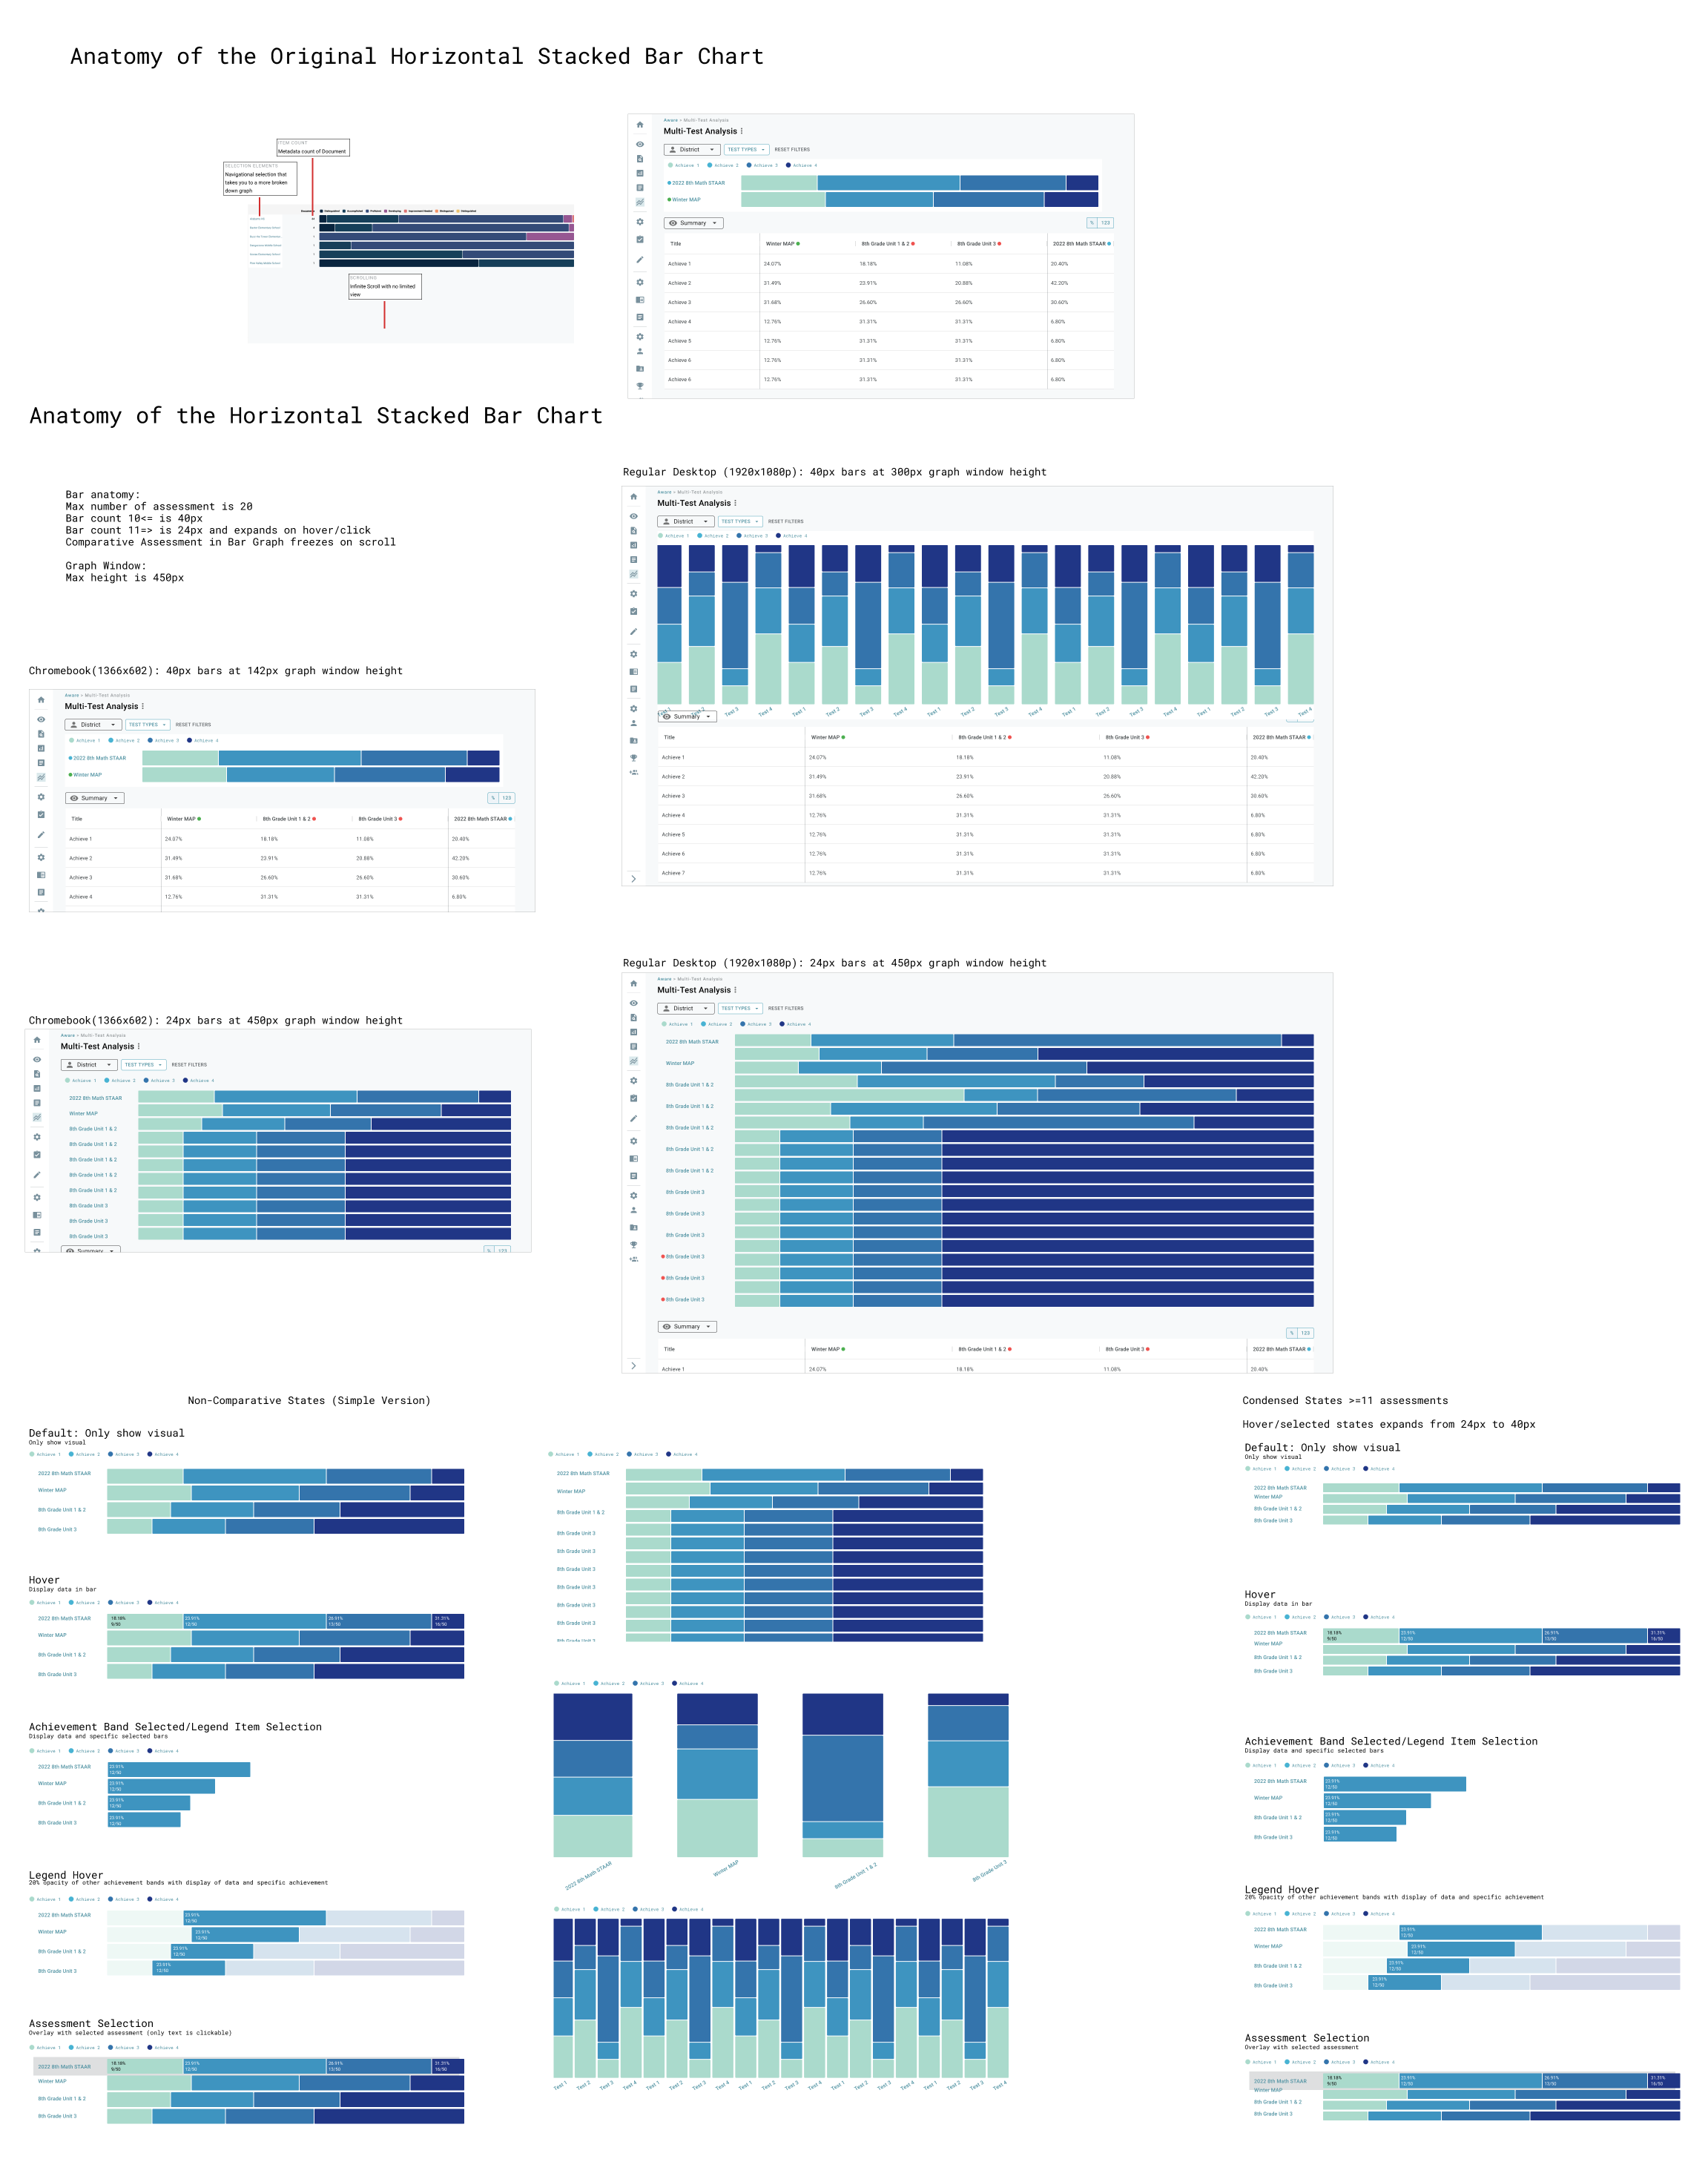
Although we felt confident in our initial design, we encountered a significant challenge when implementing bar charts for each assessment. The original design caused the charts to extend far beyond the viewport horizontally, making it difficult for users to compare the first and last assessments effectively. This issue prompted us to go back to the drawing board and explore alternative approaches.
Our first attempt to resolve this was by using stacked bar charts that would span vertically. We chose this direction because users are generally more familiar with vertical scrolling, which is a more intuitive action compared to horizontal scrolling. However, after experimenting with various designs, we ultimately settled on using horizontal bar charts. This decision was influenced by the natural reading pattern of users, which typically follows a Z-shape—left to right, then down. By aligning with this reading pattern, the horizontal bar charts not only enhanced usability but also made the comparison of data more intuitive and efficient.
Our first attempt to resolve this was by using stacked bar charts that would span vertically. We chose this direction because users are generally more familiar with vertical scrolling, which is a more intuitive action compared to horizontal scrolling. However, after experimenting with various designs, we ultimately settled on using horizontal bar charts. This decision was influenced by the natural reading pattern of users, which typically follows a Z-shape—left to right, then down. By aligning with this reading pattern, the horizontal bar charts not only enhanced usability but also made the comparison of data more intuitive and efficient.
Final Design
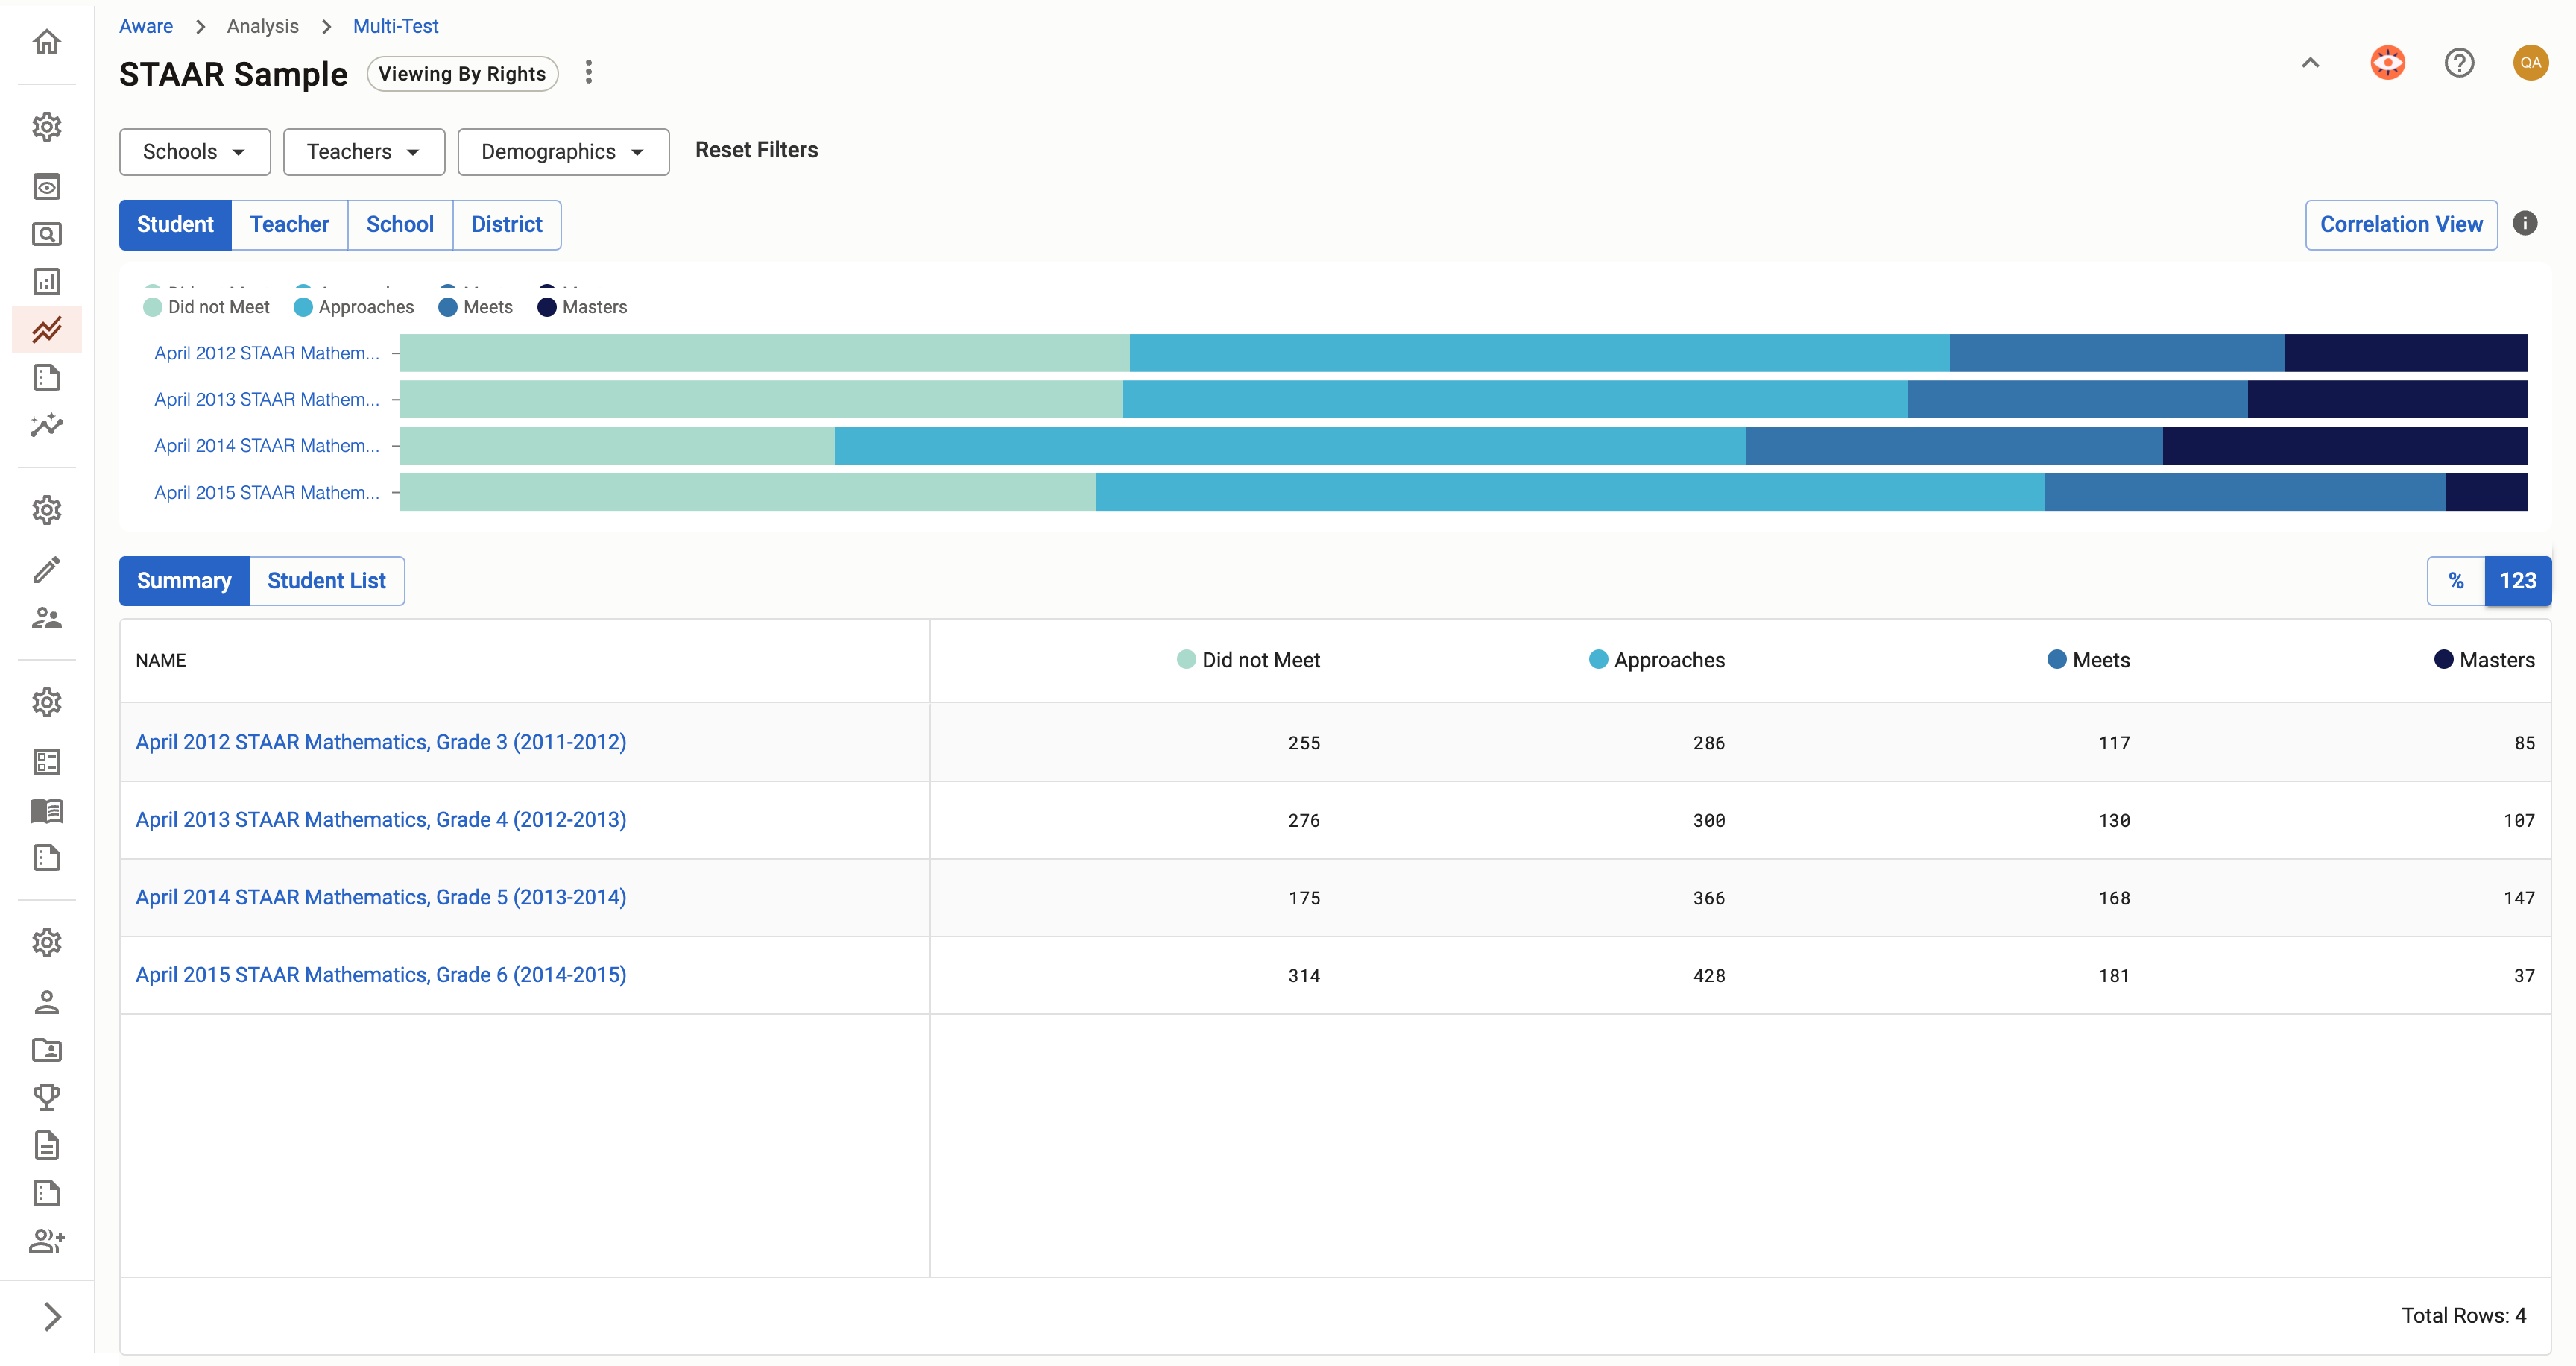
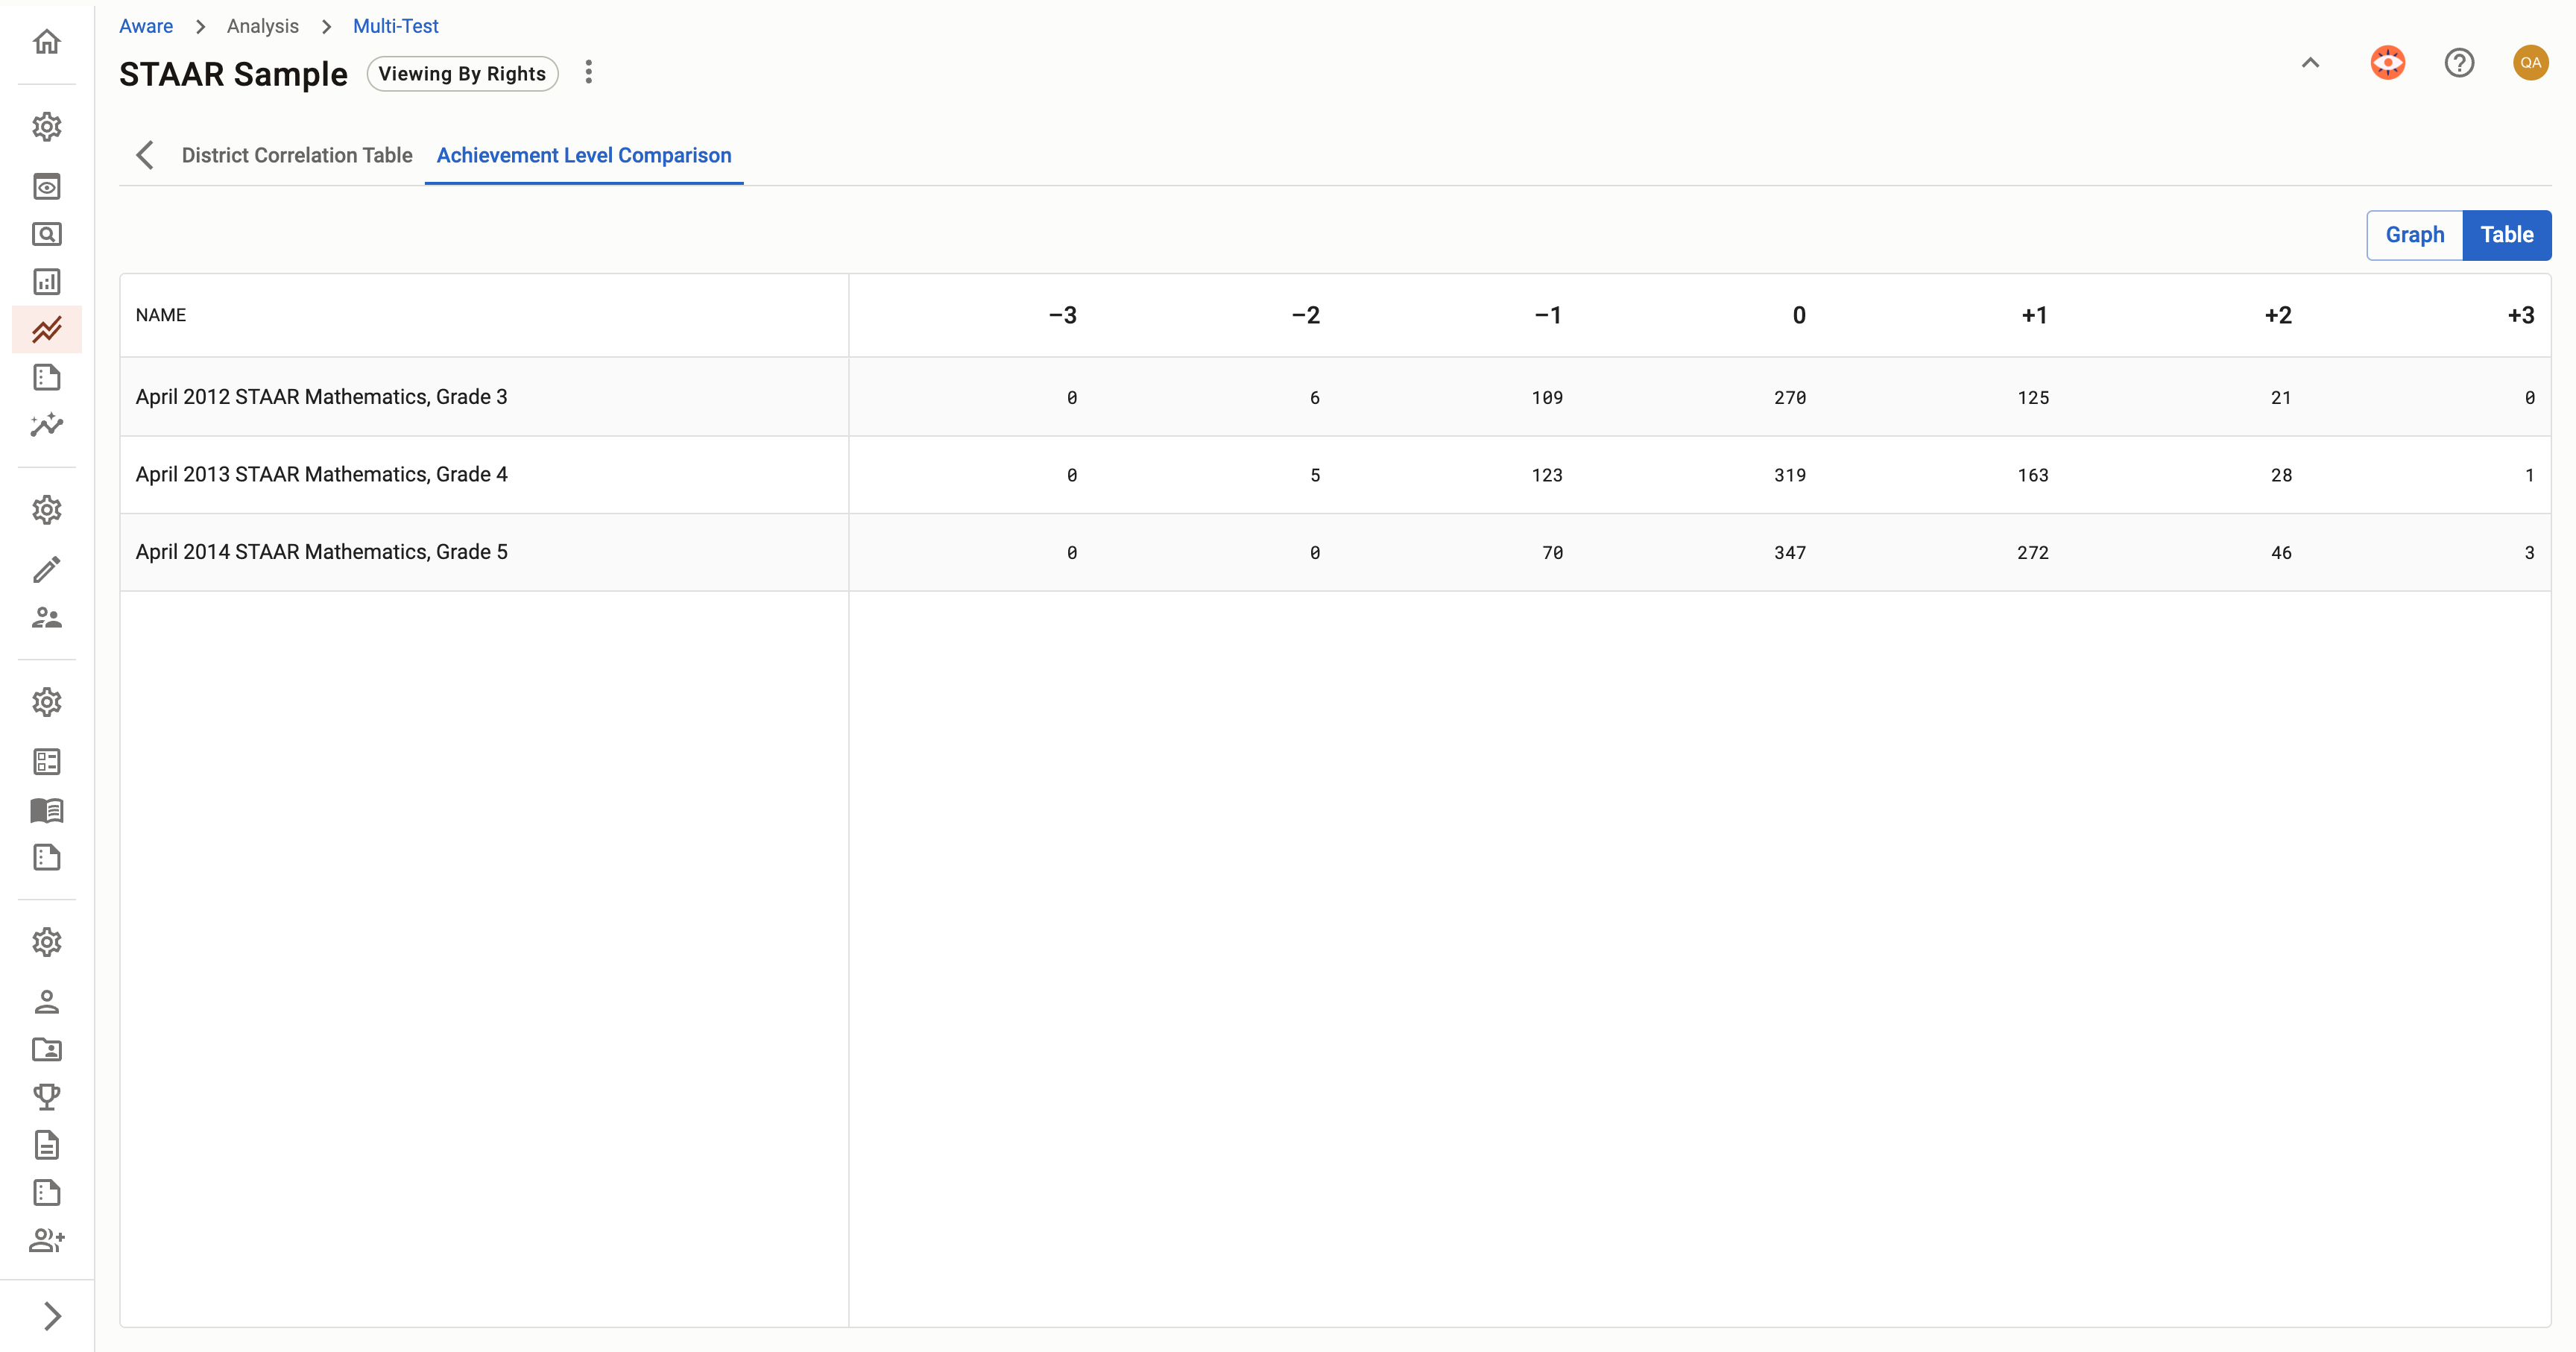
In our final design, we successfully blended bar charts with student data, enabling staff to validate the insights they see in the visualizations. By allowing different levels of granularity, this tool is now versatile enough to be effectively used by both district administrators and teachers. The streamlined process takes about five minutes, reducing the time required by at least 550% compared to previous methods.
Additionally, with the inclusion of advanced statistical data, staff now have an incredibly powerful tool at their disposal. This tool not only facilitates data generation and analysis within the same space but also empowers users to make more informed decisions quickly and efficiently. The result is a significant enhancement in how data is utilized across different levels of the education system.
Additionally, with the inclusion of advanced statistical data, staff now have an incredibly powerful tool at their disposal. This tool not only facilitates data generation and analysis within the same space but also empowers users to make more informed decisions quickly and efficiently. The result is a significant enhancement in how data is utilized across different levels of the education system.
Release and Feedback
The Multi Test Analysis tool became the third major feature added to our Aware Premium offering, joining Single Test Analysis and Standards Mastery. These features have now become the primary selling points for attracting new districts and encouraging current districts to upgrade. The release of Multi Test Analysis significantly enhanced our product’s value by enabling users to compare assessments on a common scale within the same space where students take their assessments.
This added functionality led to a substantial uptick in sales, demonstrating the strong demand for more comprehensive data analysis tools in education. As a result, we surpassed our revenue goals for the 2023 fiscal year by $750,000, marking a significant achievement for our team and validating the impact of our design and development efforts.
This added functionality led to a substantial uptick in sales, demonstrating the strong demand for more comprehensive data analysis tools in education. As a result, we surpassed our revenue goals for the 2023 fiscal year by $750,000, marking a significant achievement for our team and validating the impact of our design and development efforts.
Conclusion
Aware Premium has solidified its position as our leading product, offering unparalleled value to our customers. Contributing to this success, I have designed three integral tools within the Aware Premium suite, each aimed at transforming the way educators and administrators interact with data. These products have not only enhanced the user experience but have also played a crucial role in improving educational outcomes across districts.
Reflecting on the challenges we faced—especially the complexities of integrating diverse datasets—I am proud of how these obstacles pushed me to grow as a designer. The success of these tools, evidenced by a significant uptick in user engagement and positive feedback from educators, reinforces the impact of our work.
Looking ahead, I am dedicated to continuing this journey of innovation. My focus will be on refining and expanding our offerings, ensuring that Aware Premium remains at the forefront of educational technology. By continually enhancing the tools we provide, I am committed to supporting teachers, staff, and students in achieving their full potential.
The success of this project was made possible through the collaborative efforts of an incredibly talented team. As we move forward, I am excited to continue working together to shape the future of education.
Reflecting on the challenges we faced—especially the complexities of integrating diverse datasets—I am proud of how these obstacles pushed me to grow as a designer. The success of these tools, evidenced by a significant uptick in user engagement and positive feedback from educators, reinforces the impact of our work.
Looking ahead, I am dedicated to continuing this journey of innovation. My focus will be on refining and expanding our offerings, ensuring that Aware Premium remains at the forefront of educational technology. By continually enhancing the tools we provide, I am committed to supporting teachers, staff, and students in achieving their full potential.
The success of this project was made possible through the collaborative efforts of an incredibly talented team. As we move forward, I am excited to continue working together to shape the future of education.
Want to work together?
If you like what you see and want to work together, get in touch!
Jojuandelk@gmail.com